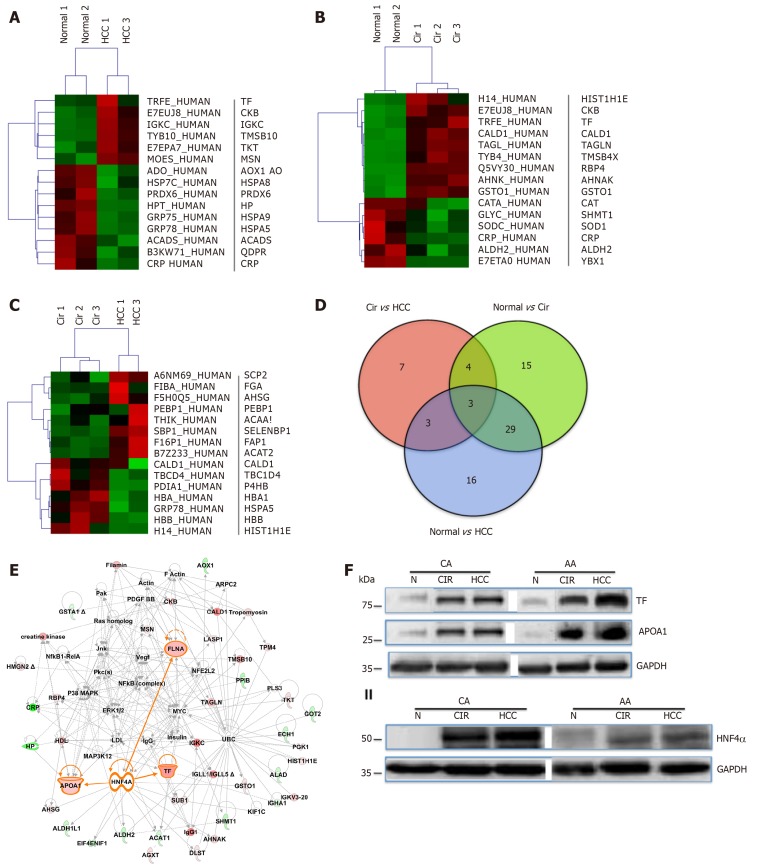
Figure 2.
Differentially expressed proteins in normal and liver disease states. Heat maps of differentially expressed proteins (DEPs) (truncated) that were selected following supervised analysis (A) Normal vs. Cirrhosis, (B) Normal vs. Hepatocellular carcinoma, (C) Cirrhosis vs. Hepatocellular carcinoma, and (D) Venn Diagram comparing the significantly DEPs identified. (E) Interactive Network Analysis of DEPs in cirrhosis and hepatocellular carcinoma as compared to normal shows HNF4α as a focus hub to many DEPs. (F) A representative of immunoblot analysis of TF and APOA1 (upper panel), HNF4α (lower panel) in tissue samples of AA & CA. GAPDH was used as a loading control, as published in[23].

