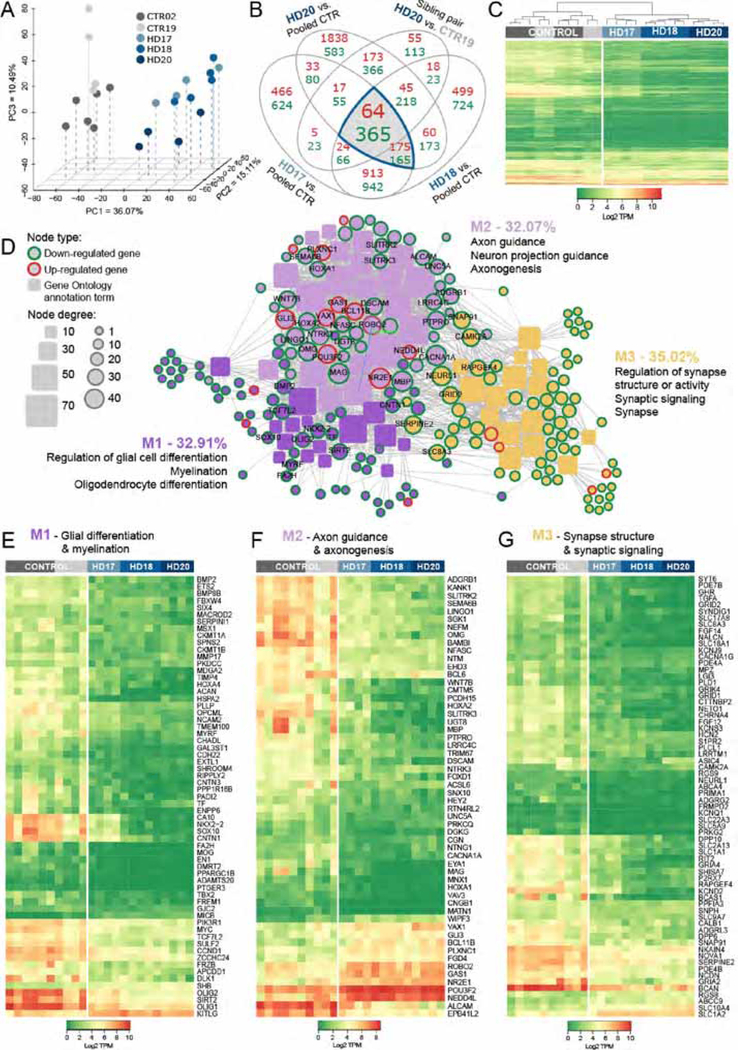
Figure 1. HD hESC-derived hGPCs display profound mHTT-dependent changes in gene expression.
A, Principal component analysis (PCA) based on expression of approximately 26,000 transcripts. The expression data are shown as transcripts per million (TPM), post-normalization to account for variance (Risso et al., 2014). The PCA plot shows the distinct transcriptome-wide expression signature of HD-derived hGPCs. B, Venn diagram shows intersections of lists of differentially expressed genes (DEGs) (green, down-regulated; red, up-regulated; fold change, FC > 2.0, FDR 1%), obtained by comparing hGPCs derived from 3 different HD patients to pooled control hGPCs from 2 donors. The list of DEGs shared by the 3 HD patients was then filtered by intersecting with those DEGs (FC > 2.0, FDR 1%) found in patient HD20 (GENEA20-derived) vs. its normal sibling CTR19 (GENEA19); this filtration step further increased the specificity of mHTT-associated DEGs. The gray-highlighted intersections together comprise the entire set of genes differentially expressed by all HD lines relative to their pooled controls. C, Expression heat-map based on transcripts per million (TPM) values for 429 DEGs highlighted in B, showing clustering of hGPCs by disease status. Dendrogram shows hierarchical clustering based on Euclidean distance calculated from log2-TPM values from the three HD-ESCs lines (HD-17, HD-18, HD-20) and the two matched control lines (CTR19, CTR02).
D, Network representation of functional annotations (Gene Ontology: Biological Process and Cellular Component, Bonferroni-corrected p<0.01) for the 429 intersection DEGs highlighted in B. Genes are round nodes with border colors representing their direction of dysregulation (green, down-regulated; red, up-regulated). Rounded rectangle nodes represent annotation terms. Nodes are sized by degree and colored by closely interconnected modules (M1 though M3) identified by community detection. For each module, 3 of the top annotations by significance and fold-enrichment are listed. Selected gene nodes are labeled, and include genes encoding key hGPC lineage transcription factors and stage-regulated proteins. E, Expression heat-map of 63 conserved DEGs identified in M1 (purple in D), annotations related to glial cell differentiation and myelination. F, Expression heat-map of 56 conserved DEGs identified in M2 (lilac in D), annotations related to axon guidance and axonogenesis. G, Expression heat-map of 68 conserved DEGs identified in M3 (yellow in D), annotations related to regulation of synapse structure and synaptic signaling.
All DE results are 1% FDR and FC >2; GO annotation results are Bonferroni-corrected to p<0.01.

