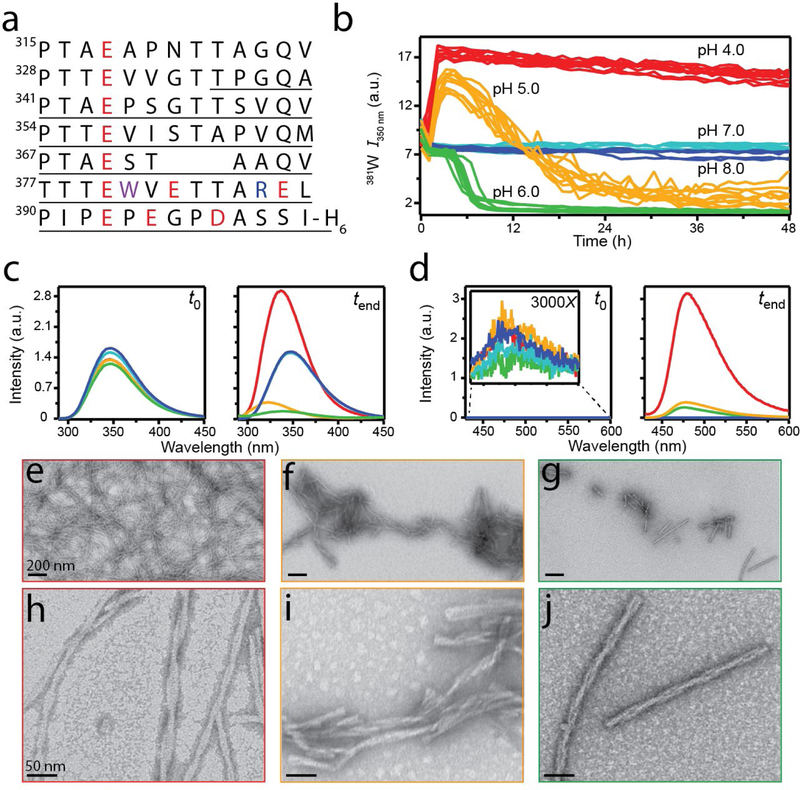
Fig. 1.
Effect of pH on sRPT aggregation. (a) The one-letter amino acid sequence of sRPT. The underlined region represents the amyloidogenic core as defined in this work. Acidic and basic residues are colored red and blue, respectively. 381W is colored in purple. (b) sRPT (30 µM) aggregation kinetics at pH 4 (red), 5 (yellow), 6 (green), 7 (cyan), and 8 (blue), monitored by 381W fluorescence at 37 °C (n = 2 microplate experiments, 5 replicates each). (c) 381W fluorescence at t0 and tend. (d) ThT binding (10 µM) to sRPT at t0 and tend. (e-j) Representative TEM images of sRPT aggregates formed at pH 4 (e, h), 5 (f, i), and 6 (g, j).

