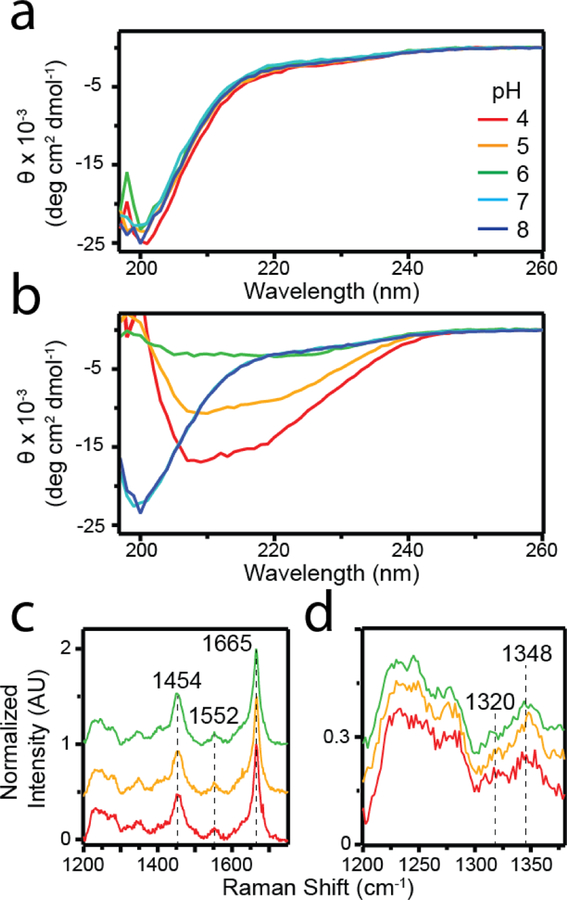
Fig 2.
Secondary structural characterization of sRPT fibrils. (a-b) CD spectra of sRPT (30 µM) aggregation reactions at pH 4 (red), 5 (yellow), 6 (green), 7 (cyan), and 8 (blue) at the beginning (t0, a) and end (tend, b) of the reactions. Θ is defined as the mean residue ellipticity. (c) Raman spectra of sRPT aggregates at tend. (d) Expanded view of 1200–1380 cm−1 region of the spectrum.

