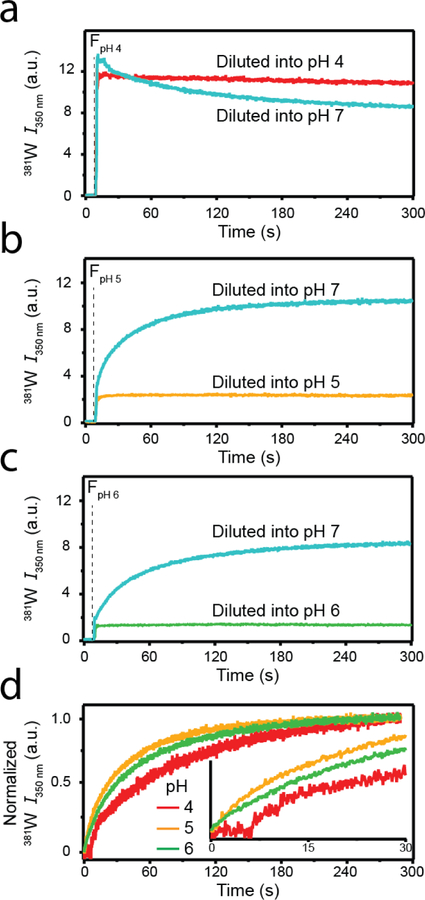
Fig. 3.
Disaggregation kinetics of sRPT fibrils. Fibrils formed at pH 4 (a), 5 (b), or 6 (c) were diluted 6-fold into their corresponding buffers (red, yellow, and green curves) or into pH 7 buffer (cyan curves). The vertical dashed line represents the timepoint when sRPT aggregates were introduced. (d) Normalized 381W fluorescence change after diluting into pH 7 buffer for fibrils formed initially at pH 4 (red), 5 (yellow), and 6 (green). (Inset) an expanded view of the first 30 s. The data are representative of two independent experiments.

