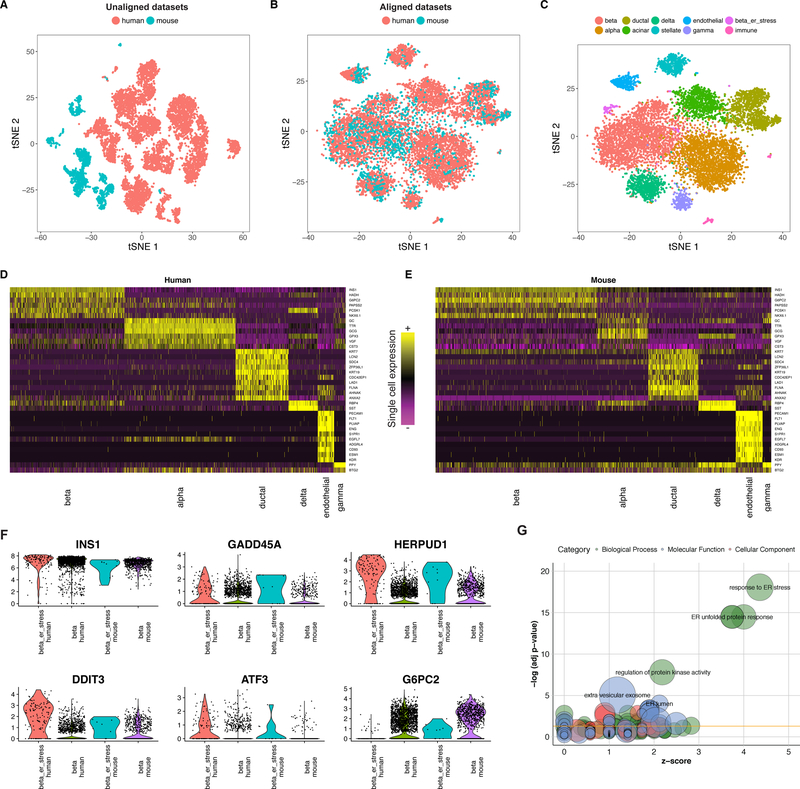
Figure 4. Joint identification of cell types across human and mouse islet scRNA-seq atlases.
(A-C) tSNE plots of 10,191 pancreatic islet cells from human (n = 8,424 cells) and mouse (n = 1,767 cells) donors, prior to (A) and post (B) alignment. After alignment, cells group across species based on shared cell type, allowing for a joint clustering (C) to detect 10 cell populations. (D-E) Unsupervised identification of shared cell-type markers between human and mouse. Single cell expression heatmap for genes identified with joint DE testing across species. (F) Violin plots showing the distribution of gene expression of select genes in the beta cell cluster for human (n = 2,431 cells) and mouse (n = 762 cells) and the stressed beta cell clusters for human (n = 126 cells) and mouse (n = 10 cells). (G) Top n=100 genes up-regulated in the ‘ER-stress’ subpopulation of beta cells in both species are strongly enriched for components of the ER unfolded protein stress response. GO enrichment is visualized using the GOplot R package.

