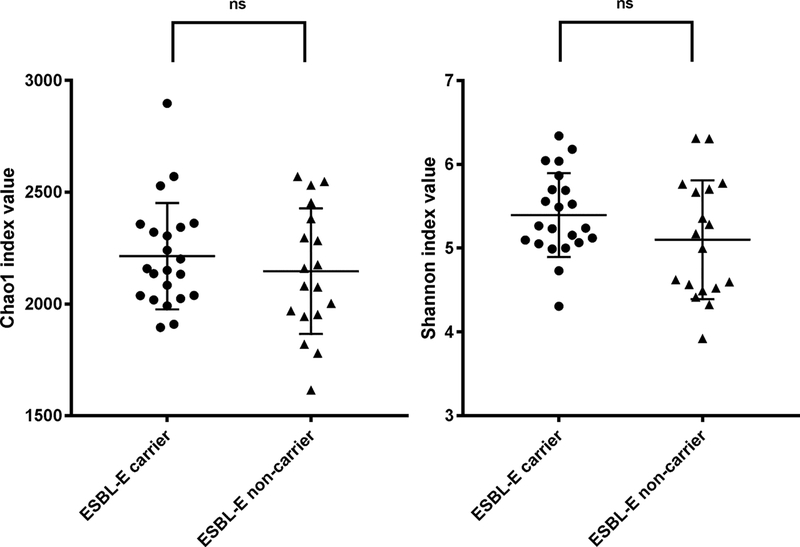
Figure 3. Microbiome alpha diversity in ESBL-E carrier and non-carriers.
Alpha diversity was calculated for species richness by the Chao1 and for both richness and evenness by the Shannon diversity index. Differences in Chao1 richness estimator values and Shannon index values were analyzed using a nonparametric t test with 999 permutations. Data are presented as a scatter plot with mean and standard deviation (S.D.).

