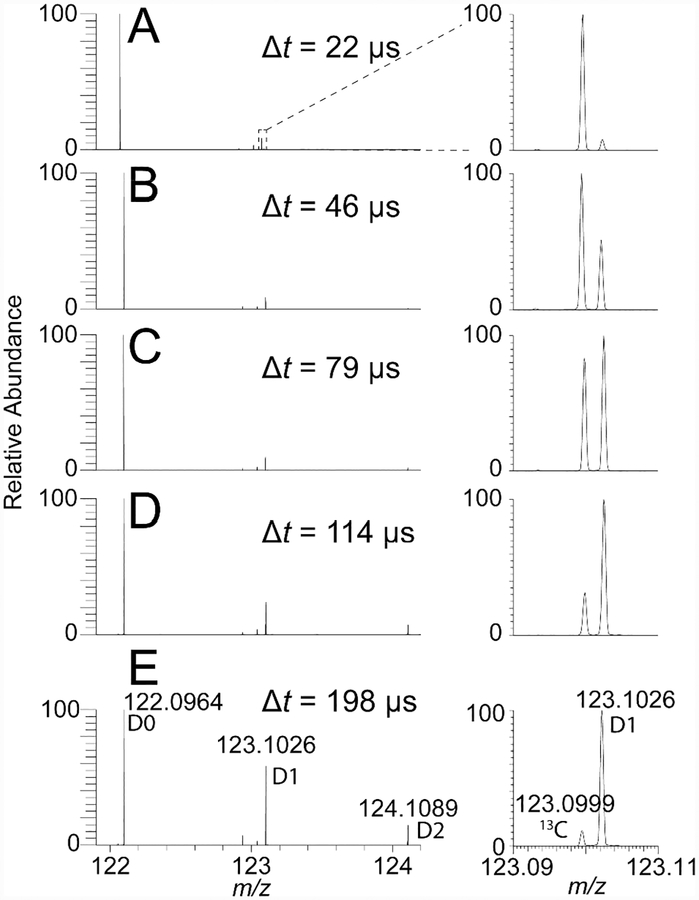
Figure 1.
Hydrogen–deuterium exchange observed in phenethylamine m/z 122.096 (D0), with nanoESI using a theta-capillary. The extent of deuteration (D1, m/z 123.103; D2, m/z 124.109) increases by moving the capillary further back from the inlet of the mass spectrometer. (A) Δt = 22 μs, TIC: 2.4 x 10⁵; (B) Δt = 46 μs, TIC: 3.1 x 10⁵; (C) Δt = 79 μs, TIC: 2.5 x 10⁵; (D) Δt = 114 μs, TIC: 1.4 x 10⁵; and (E) Δt = 198 μs, TIC: 6.4 x 10⁴; where Δt is the average dwell time for droplets in air before entering the mass spectrometer, and TIC is the total ion current. The inset on the right (m/z 123.09–123.11) of each panel shows the relative intensities of the naturally occurring 13C isotope (left) and the D1 isotope (right) of a protonated phenethylamine ion.

