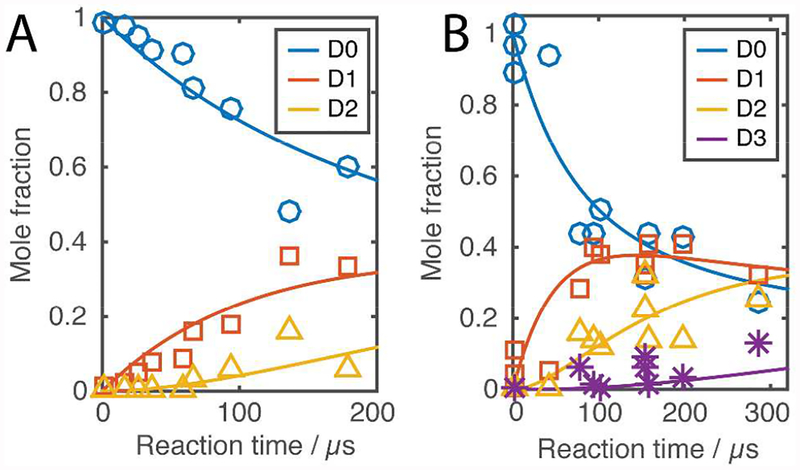
Figure 3.
Isotopic patterns resulting from HDX in (A) phenethylamine and (B) angiotensin I (after spectral deconvolution) provided the kinetic behavior of individual components. Labels indicate the monoisotopic peak D0, first deuterated peak D1, second deuterated peak D2, etc. The graphs show the solutions for the systems of ordinary differential equations based on the obtained forward and backward reaction rates. Increasing the distance between the capillary tip and the inlet of the mass spectrometer results in an increased reaction time. As a result, the monoisotopic compound decreases in intensity as HDX proceeds.

