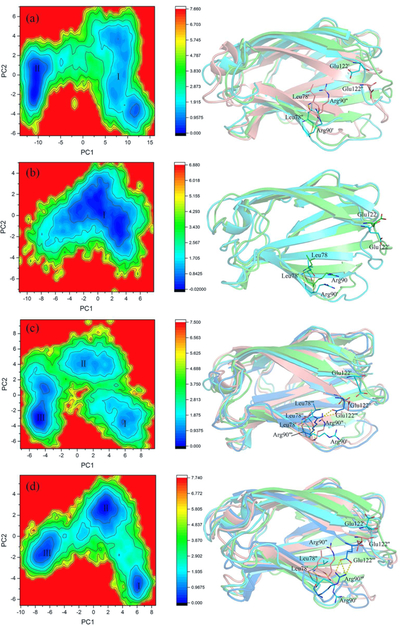
Figure 7.
FEL analysis of MD trajectories of apo MD-2 (a), lipid A-MD-2 (b), 4-MD-2 (c) and 5-MD-2 (d). The representative MD-2 structures corresponding to each FEL basin with the lowest-energy were also shown. State I: cyan color; State II, salmon color; State III, marine color. Key residues involving hydrogen bond interactions at the mouth of MD-2 cavity are shown as stick. Free energy values are given in kcal/mol as indicated by the color bars.

