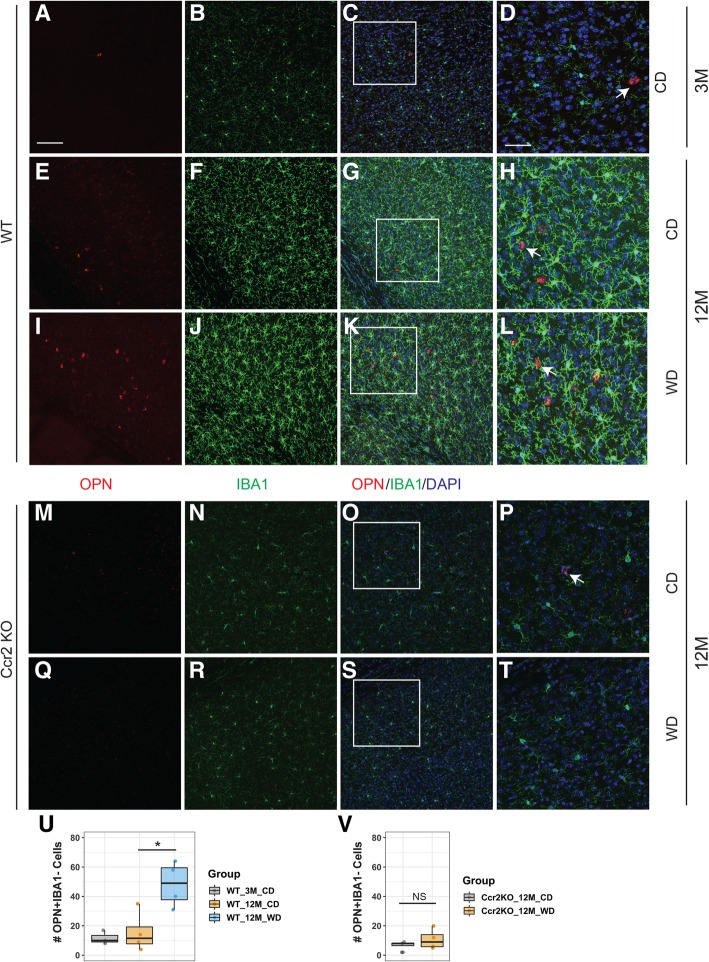
Fig. 7.
WD increased OPN+IBA1− cells in the brain. a–l Representative cortical sections on OPN (red) and IBA1 (green) staining from 3-month WT mice fed a CD (a–d), 12-month-old WT mice fed a CD (e–h) or WD (i–l). m–t Representative cortical sections on OPN (red) and IBA1 (green) staining from 12-month Ccr2-KO mice fed a CD (m–p), or WD (q–t). d, h, l, p, and t are magnified images cropped from c, g, k, o, and s, respectively. Arrows indicate examples of OPN+IBA1− cell in each group. u Box plots showing the number of OPN+IBA1− cells (sum of cell numbers from seven images per animal) in 3-month WT CD-fed mice, and 12-month CD or WD-fed WT (one-way ANOVA followed by Tukey HSD post hoc test, *p = 0.016). v Box plots showing the number of OPN+IBA1− cells (sum of cell numbers from seven images per animal) in 3-month Ccr2-KO and 12-month CD or WD-fed WT (T test; not significant, NS). Scale bars: a–c, e–g, i–k, m–o, and q–s, 100 μm

