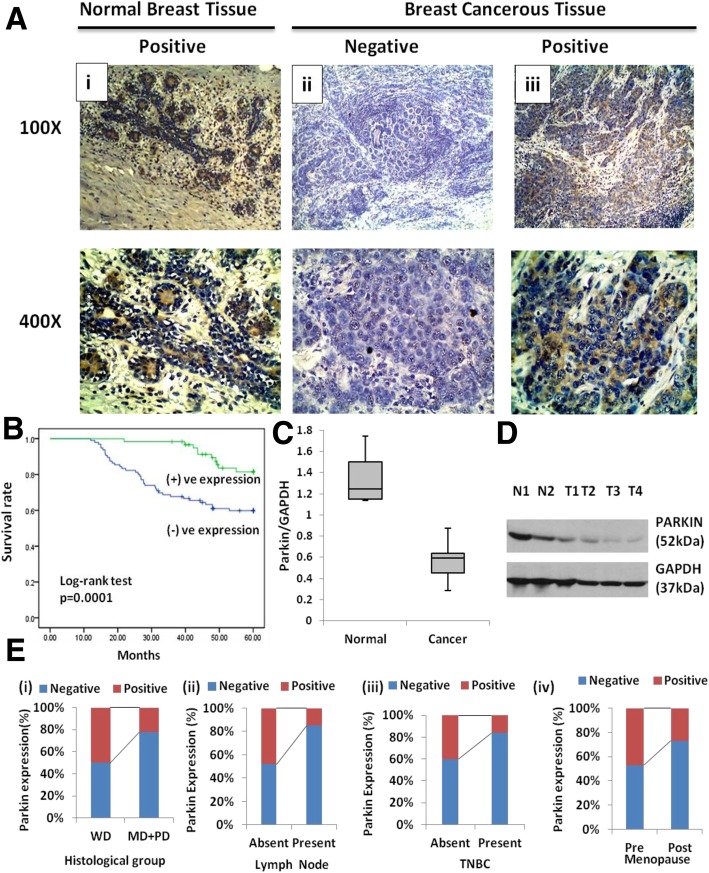
Fig. 3.
Parkin (PARK-2) expressional analysis. a Immunohistochemical analysis of Parkin protein in breast tissue at 100X and 400X magnifications. (i) Parkin positive expression in normal tissue, (ii) Parkin negative expression, (iii) Parkin positive expression in breast carcinoma respectively (Scale bar: 1000 μm). b The Survival curve was analyzed according to the expression status of Parkin protein (SPSS version 17.0). c Parkin protein expression in breast cancer tissues, N-Normal, T-Tumor. d Frequency distribution of Parkin expression with (i) Lymph node, (ii) histological grade and (iii) TNBC cases (p < 0.05). e Distribution of the Parkin/GAPDH ratio in normal and breast cancer tissues

