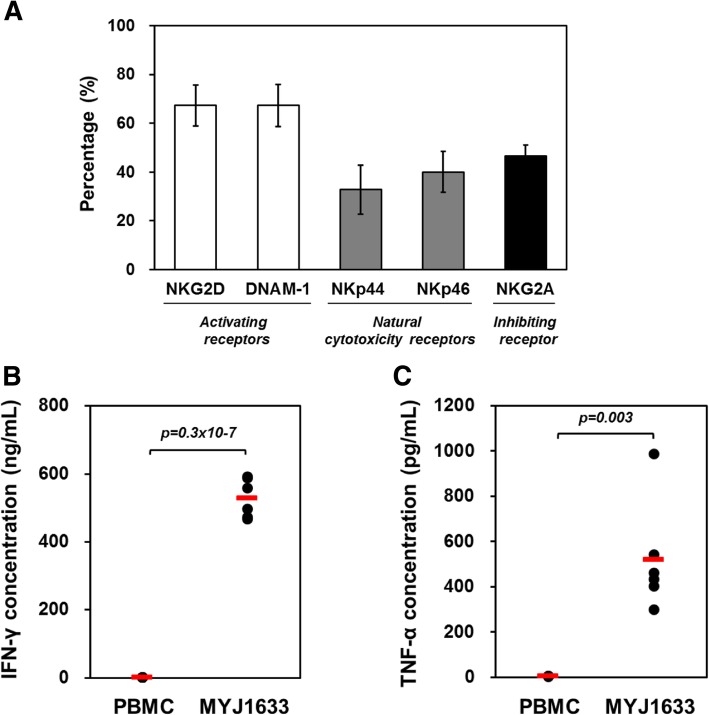
Fig. 3.
Functional receptor expression and cytokine production of MYJ1633. (a) The expression of activating, natural cytotoxicity, and inhibiting receptors on CD16+ CD56+ MYJ1633 was determined by using flow cytometry. The data was analyzed from 6 individuals (Additional file 1: Figure S2). The data represented as mean ± SEM. (b) IFN-γ and (c) TNF-α levels in cell culture supernatants of PBMCs and MYJ1633 were quantitatively measured using sandwich ELISA system. Significant differences between PBMC and MYJ1633 from 6 individuals were determined by Student’s t test. The mean value of each group is indicated with red bars

