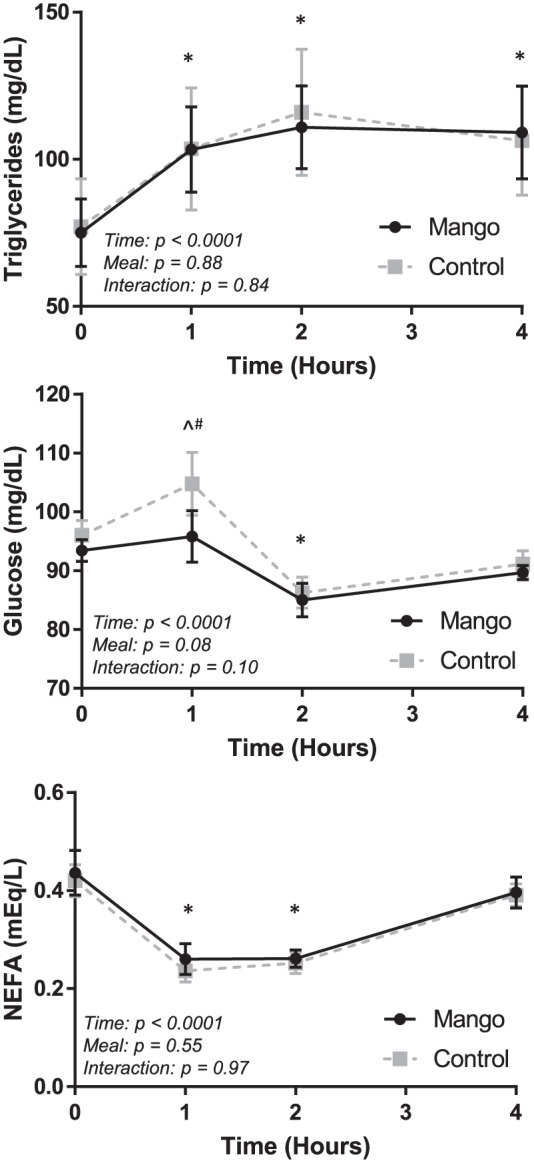
Figure 1.

Fasting and postprandial metabolic values in the Mango and Control trials. Triglycerides (top panel), glucose (middle panel), and NEFA (bottom panel) were assessed at baseline/fasting (time 0) and 1, 2, and 4 hours after the high-fat meal. Significant differences (P < .05) at specific time points reflect the results of a two-way (trial × time) repeated measures ANOVA. Error bars reflect SEM.
NEFA indicates nonesterified fatty acids.
*Both groups different from baseline, P < .05.
^Control different from baseline, P < .05.
+Mango different from baseline, P < .05.
#Mango different than Control, P < .05.
