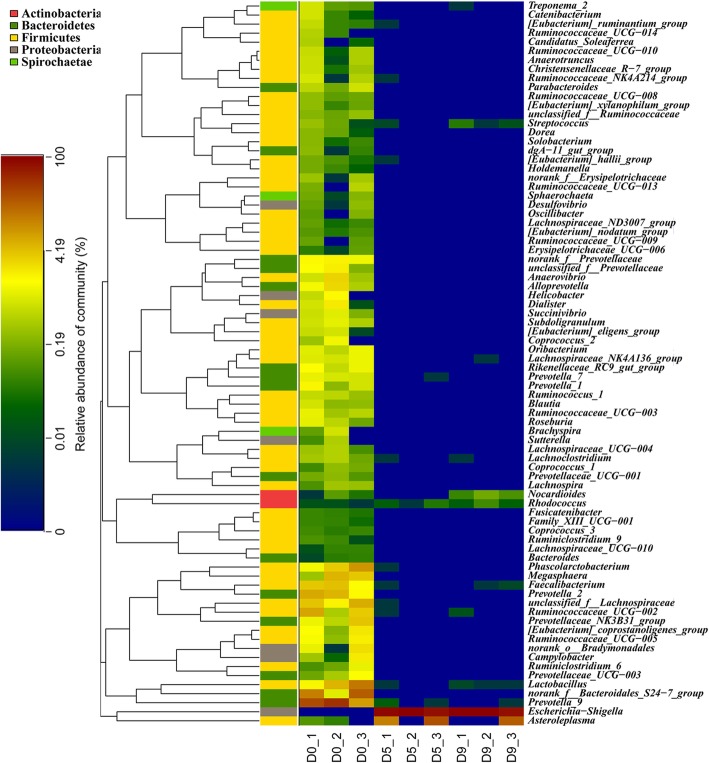
Fig. 2.
The bacterial microbiome was obviously depleted by treatment with antibiotics. Heatmap of the OUT percentage of every genus at 3 timepoints. Each point represents 3 biological replicates. The genera that belong to the same phylum are shown in the same color on the left. The total OTU number of 3 biological replicates for every genus was more than 10. The color bar represents the log of the percentage, the numbers in the heatmap are the log values of the OTU numbers, and the numbers in the bar are the percentages

