Fig. 2.
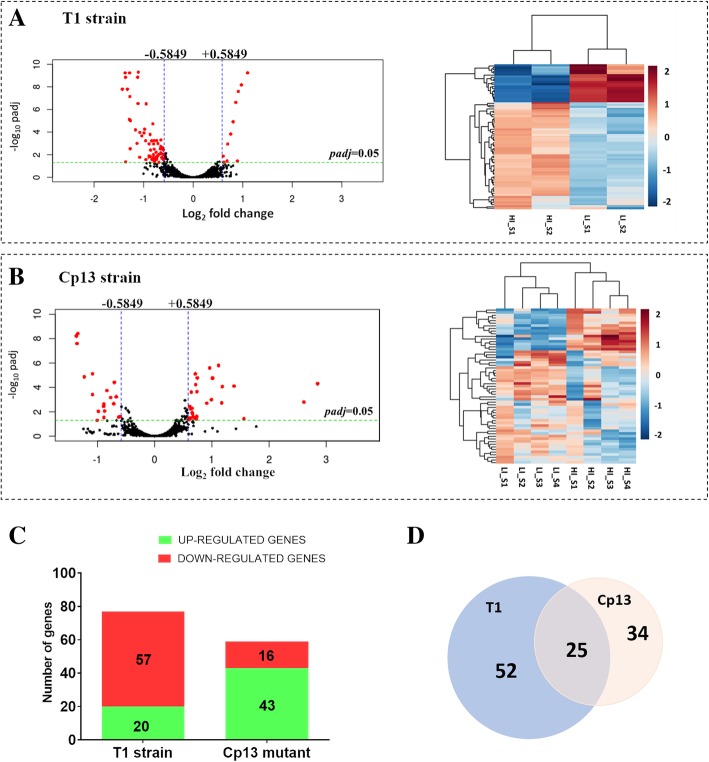
Differential gene expression of C. pseudotuberculosis CpT1 strain and Cp13 mutant under iron limitation. Counts were normalized using DESeq2 and differentially expressed genes were filtered using a false discovery rate (FDR) of < 0.05 and a log2fold change > 0.5849 or < − 0.5849 for biological significance. Volcano plots (on the left) of the log2-fold change of each detected gene in relation to their -log10 of adjusted p values and heatmaps (on the right) are shown in figure a for the 77 differentially expressed genes in the wild-type T1 strain and figure b shows 59 DEGs in the Cp13 mutant. In the volcano plots threshold of log2fold change and p adjusted value are represented by blue and green lines, respectively. Rlog-transformed normalized counts in the heatmap were clustered based on Euclidean distance. Rows indicate genes and columns represent individual samples from the two experimental conditions (LI and HI represent low iron and high iron conditions, respectively). c Stacked-bar graph representing the total number of the up and down-regulated genes identified in the T1 and Cp13 strains, considering a greater than 1.5-fold change (log2fold change 0.5849 and − 0.5849), where 57 and 16 genes with diminished expression, 20 and 43 genes with increased expression under iron restriction are specified. d Comparative analysis of the DEGs between wild-type and Cp13 mutant is represented by a scaled Venn diagram showing 52 genes expressed only in the wild-type T1 strain, 34 genes expressed only in the Cp13 mutant and 25 genes common to both wild-type and mutant (intersection)

