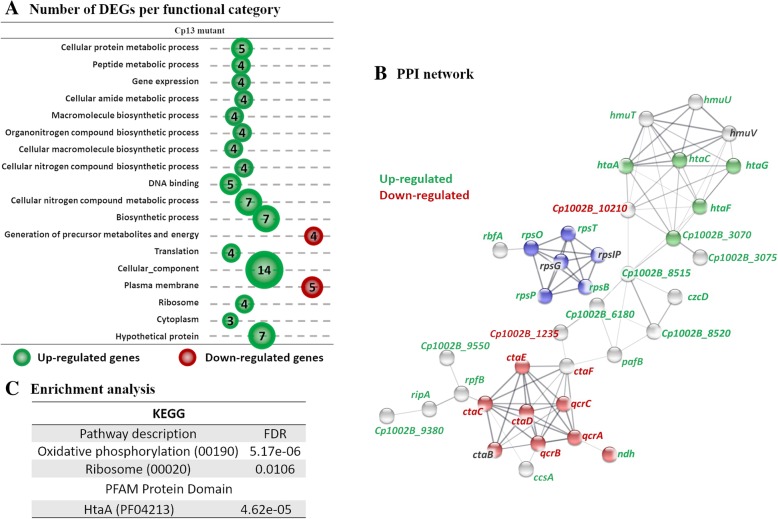
Fig. 4.
Functional annotation and PPI analysis of the DEGs in the Cp13 mutant. a The number of differentially expressed genes are shown by functional categories, where circle sizes are proportional to the number of genes with significant differential expression. Green circles represent genes with increased expression and red circles represent genes with diminished expression. Only terms with > 2 genes assigned to a functional category are shown. b PPI analysis was carried out using the STRING database analysis tool and line thickness indicates the strength of data support for each interaction. Only connected nodes and interaction with a medium (> 0.4), high (> 0.7) and highest confidence (> 0.9) are visualized in the network. Node colors represent enriched functional categories and gene identification color represents up-regulation (green), down-regulation (red) and unchanged expression (gray). p-value of PPI interactions indicates significance of protein association. Cp13 PPI interactions contained 56 nodes and 94 edges with a PPI interaction enrichment p-value of 6.02e-14 (Additional file 5: Figure S4). Three enrichments are shown: oxidative phosphorylation (red), ribosome (blue) and HtaA domain (green). c Enrichment analysis was conducted using STRING and significant expressed categories (FDR < 0.05) are indicated

