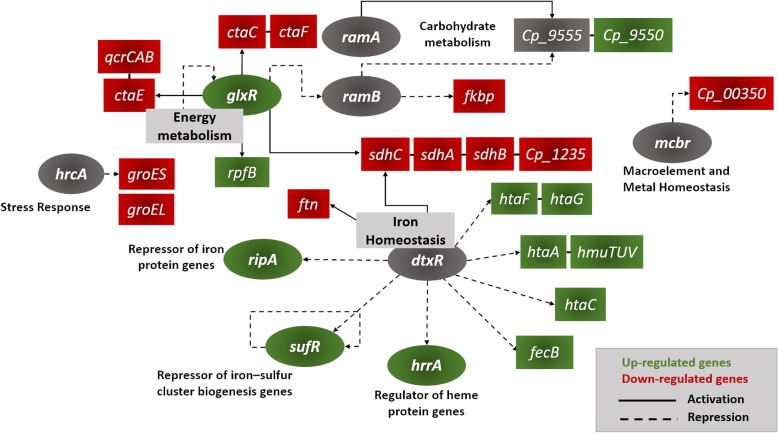
Fig. 6.
Gene network of the DEGs between wild-type T1 strain and Cp13 mutant. Networks shown involve DEGs identified in the transcriptional profile of both strains. TF genes are shown as circles. The colors represent the type of expression pattern and it is consistent with data in Table 1. Green indicates up-regulated genes, red indicates down-regulated genes and gray indicates genes with no difference in fold-change expression. Black solid lines represent transcriptional activation of the target gene and black dashed lines represent transcriptional repression of the target gene. Connected genes represent operons

