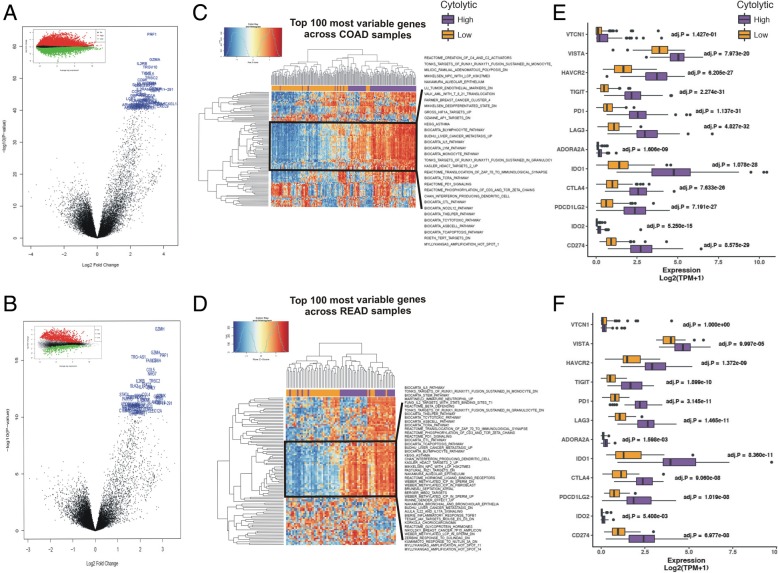
Fig. 2.
a-b Volcano plots for differential gene expression (average log fold change) in the two cytolytic subgroups of COAD (a) and READ (b) tumors. The top 100 significantly upregulated genes in CYT-high tumors are highlighted in blue. The mean-difference (MD) plots on top of each subfigure depict the up- (red) and down-regulated genes (green) in CYT-high vs -low tumors. c-d Two-way hierarchical clustering of differentially activated pathways at 0.1% false discovery rate (FDR) in the CYT-high COAD (c) and READ (d) tumors. Both datasets were statistically enriched for immune gene programs, which contain markers for T-cell inhibition and CD8+ T-cells and B-cells. e-f The expression of several inhibitory immune checkpoint molecules, including VTCN1, VISTA, HAVCR2, TIGIT, PD-1, LAG3, ADORA2A, IDO1, IDO2, CTLA-4, CD274 (PD-L1) and PDCD1LG2 (PD-L2) was significantly higher in the CYT-high immune cytolytic subgroups of the COAD (e) and READ (f) datasets

