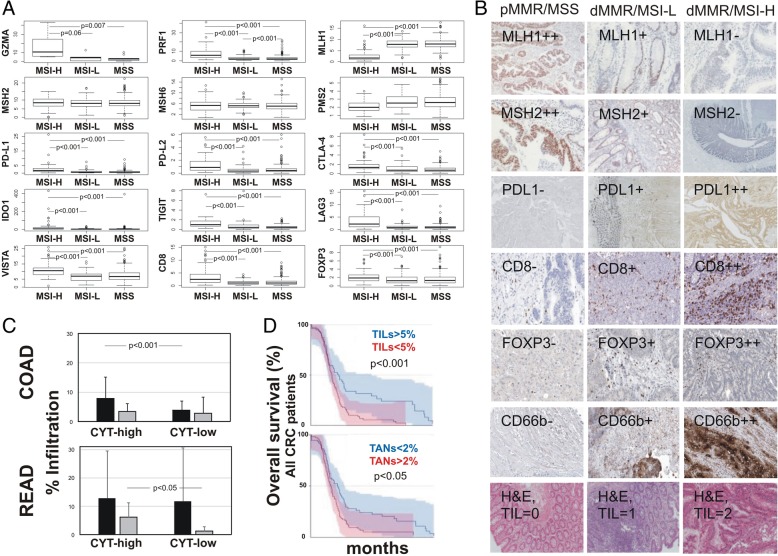
Fig. 6.
a Boxplots depicting expression levels of GZMA, PRF1, CD274 (PD-L1), PDCD1LG2 (PD-L2), CTLA-4, IDO1, TIGIT, LAG3, VISTA, CD8, FOXP3, MLH1, MSH2, MSH6, and PMS2, as measured by RT-qPCR in an independent cohort of 72 colorectal adenocarcinomas (12 MSI-H, 13 MSI-L and 47 MSS). b IHC staining for MLH1, MSH2, PD-L1, CD8, FOXP3, and CD66b in pMMR/MSS, dMMR/MSI-L and dMMR/MSI-H CRC patients. H&E, hematoxylin and eosin staining. c The percentage of tumor-infiltrating lymphocytes (TIL, black bars) and tumor-associated neutrophils (TAN, grey bars) in cytolytic high and low colon (COAD) and rectum (READ) adenocarcinomas, respectively. In the COAD dataset CYT-high tumors had higher TIL load; whereas in the READ dataset, CYT-high tumors had higher TAN load. d Overall survival between all CRCs with high or low TIL and TAN load, respectively. The patients were separated into high and low TIL or TAN groups, based on the median numbers of TILs and TANs (5% and 2%, respectively)

