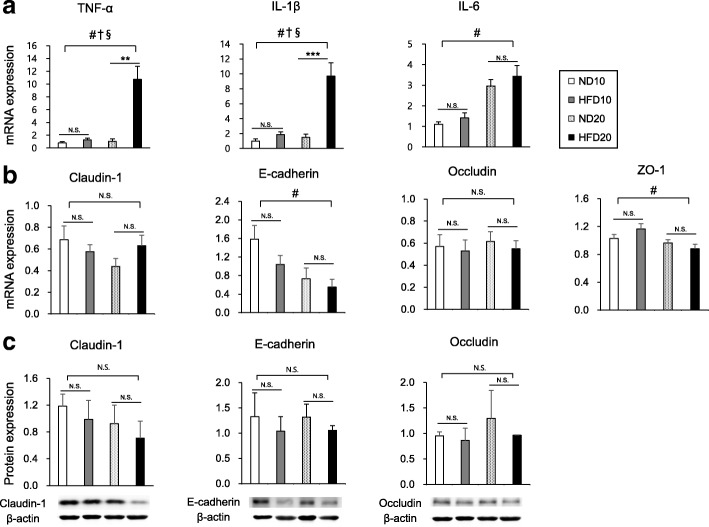
Fig. 2.
Effect of dietary fat intake on colonic expressions of proinflammatory cytokines (a) and tight junction markers (b and c). Data are means ± SEM. Data were analyzed by Student’s t-test (** P < 0.01, *** P < 0.001) and two-way ANOVA (#, P < 0.05 for age effect; †, P < 0.05 for diet effect; §, P < 0.05 for the interaction between age and diet). ND10, normal fat diet for 10 weeks (n = 15 for a, b and n = 6 for c); HFD10, high-fat diet for 10 weeks (n = 15 for a, b and n = 6 for c); ND20, normal fat diet for 20 weeks (n = 15 for a, b and n = 6 for c); and HFD20, high-fat diet for 20 weeks (n = 16 for a, b and n = 5 for c)

