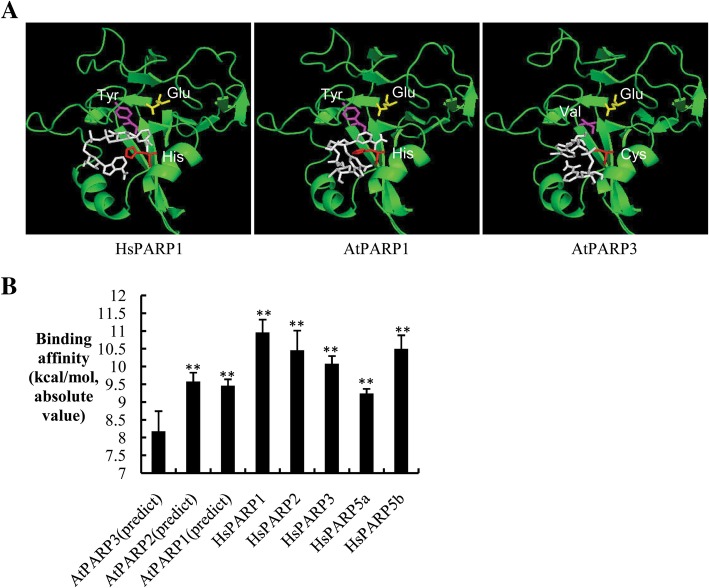
Fig. 4.
Binding affinity calculations between PARPs and NAD+. a Molecular docking simulation of PARPs and NAD+. Representative images of binding between the PARP catalytic domain (green) and NAD+ molecule (white) analyzed using AutoDock software. The histidine (cysteine in AtPARP3), tyrosine (valine in AtPARP3) and glutamate residues of the H-Y-E (C-V-E in AtPARP3) triad motif are labeled in red, magenta and yellow, respectively. The HsPARP1 structure was extracted from a previously published crystal structure (PDB ID: 1UK1). The AtPARP1 and AtPARP3 structures were generated using the homology-based protein structure prediction software Phyre2 [38]. b Binding affinities generated by in silico molecular docking. For each protein, the molecular docking experiment was repeated five times with the same parameter settings. The average from the top binding affinity from the various time point was used to evaluate the protein’s binding affinity to the NAD+ molecule. The structural information for human HsPARP1, HsPARP2, HsPARP3, HsPARP5a and HsPARP5b was downloaded from PDB, and the structures of Arabidopsis PARPs were modeled using Phyre2. Significant differences were determined using Student’s t-test. **P < 0.01

