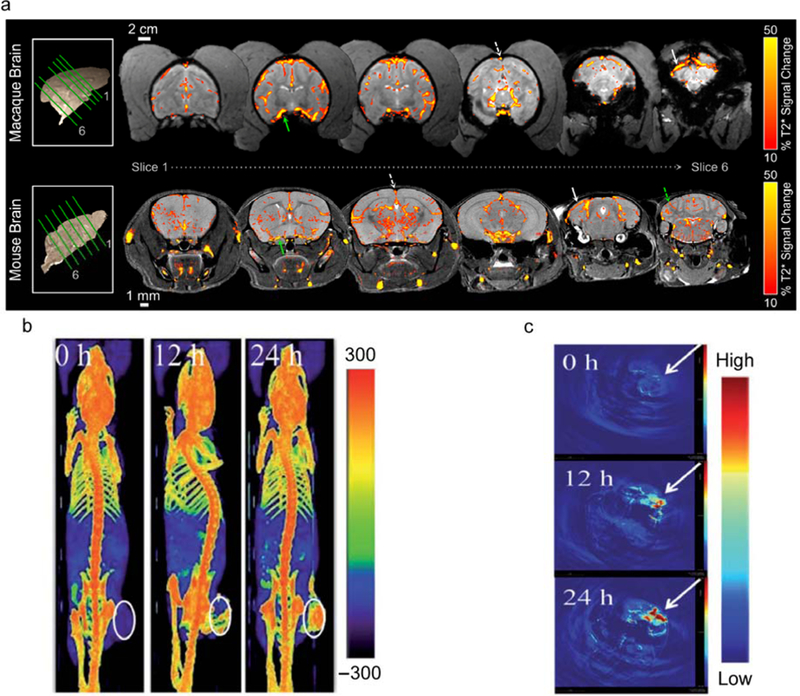
Figure 3.

Imaging iron-oxide- and gold-core NPs for tracking of biodistribution and drug delivery. (a) Contrast enhancement in MRI allows for the visualization of iron oxide NPs throughout the brain. A comparison of the distribution of iron oxide NPs in the brains of macaques (top row) and mice (bottom row) is accomplished by comparing the change in T2*-weighted signal before and 30 minutes after NP injection. (b) CT and (c) photoacoustic imaging enabled by gold NPs in mice bearing flank tumors. The white circles in (b) and the white arrows in (c) indicate tumor locations. Panel a was reprinted with permission from ref 24. Copyright 2017 American Chemical Society. Panels b and c were adapted with permission from ref 28. Copyright 2017 WILEY-CVH Verlag GmbH & Co.
