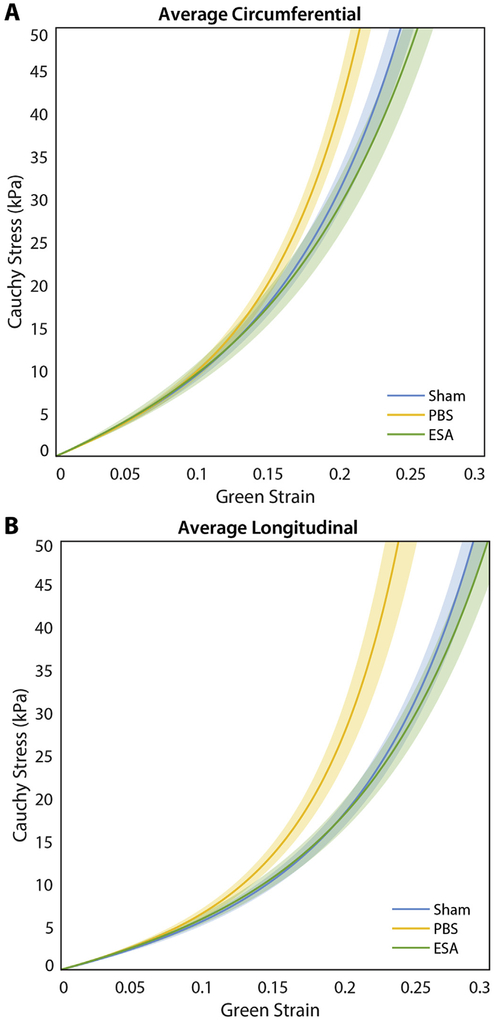
Fig. 4. Composite stress-strain curves.
Stress-strain curves are illustrated for the circumferential (A) and longitudinal (B) directions, derived from the average Fung model curves for sham non-infarcted hearts, saline-injected infarcted hearts (PBS), and therapy-treated infarcted hearts (ESA). Shaded region represents standard error. Hearts in the PBS group exhibit stiffer behavior compared to hearts in the ESA and sham groups in both the circumferential and longitudinal directions.

