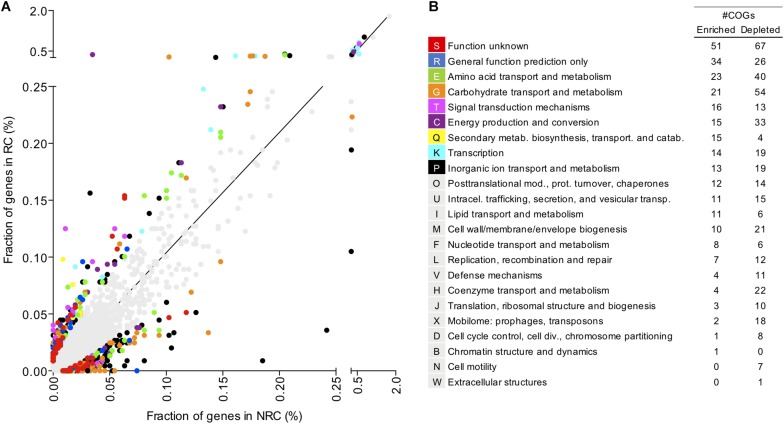
FIGURE 5.
Functional enrichment analysis of COGs shows that specific enriched and depleted functions are associated to robust colonization lifestyle. (A) Each dot in the graph represents a distinct COG and the fraction of genes associated with that COG in robust colonizers (RC) and non-robust colonizers (NRC). Fraction of genes was determined as the number of genes assigned to a given COG divided by the total number of genes in RC and NRC. Colored dots represent COGs that are significantly (P < 0.05) enriched or depleted in robust colonizers. Gray dots are COGs not significantly enriched or depleted. (B) Number of COGs significantly enriched or depleted in the robust colonizers. COG names were shortened when necessary. Enriched and depleted COGs are listed in Supplementary Table S6.

