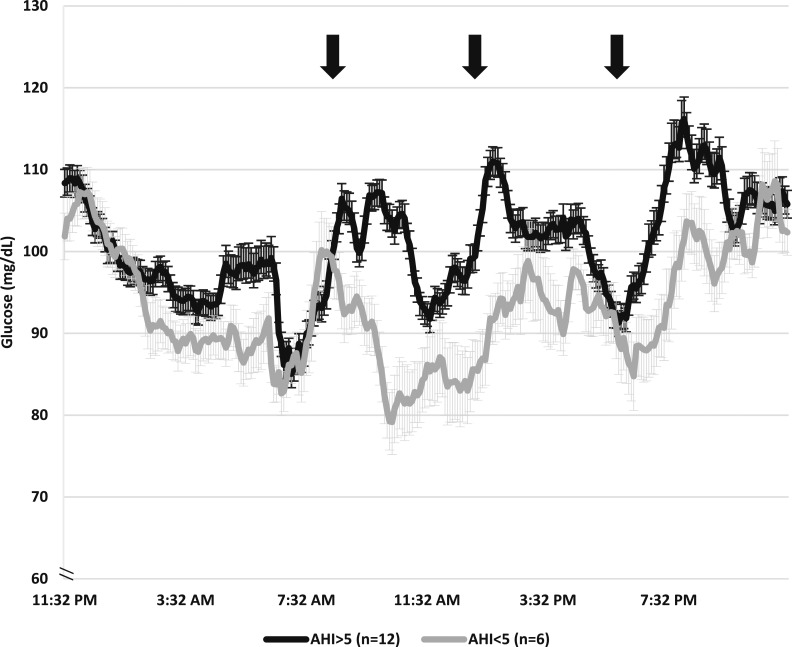
Figure 1.
Twenty-four–hour patterns of glycemia higher in women with OSA compared with women without OSA. Black line represents women with at least mild OSA (AHI ≥5), and gray line represents women with no OSA (AHI <5) (mean ± SEM). Mean 24-h glucose AUC was significantly higher in women with OSA (144,140.5 ± 3029.5 mg⋅min/dL) compared with women without OSA (131,697.1 ± 5402.6 mg⋅min/dL, P < 0.05). Black arrows indicate approximate meal start times.

