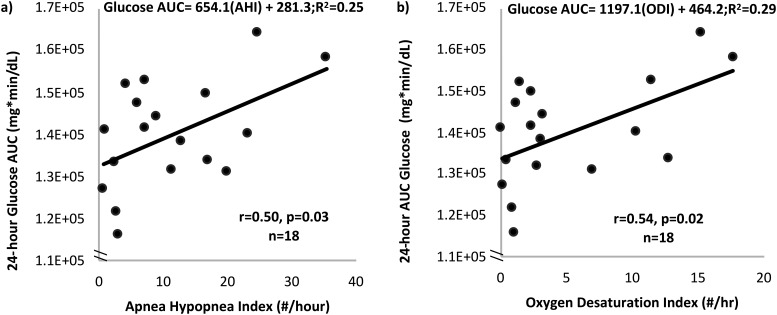
Figure 2.
Increasing severity of OSA is related to higher patterns of 24 glucose AUC. (a) Increasing AHI (number of apneas and hypopneas per hour of sleep) was significantly correlated with increasing 24-h glucose AUC measured using continuous glucose monitors. (b) Increasing ODI (number of times oxygen saturation drops ≥4% from baseline per hour of sleep) substantially was significantly correlated with increasing 24-h glucose AUC measured using continuous glucose monitors.

