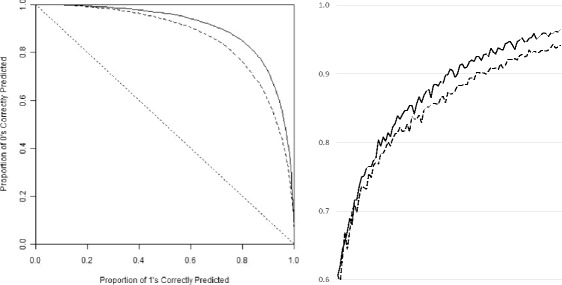
Fig. 4.

Left: Example shows contribution of Utilitarian and Informational Reinforcement variables using 2 connectionist models (46 hidden nodes) – one includes Utilitarian and Informational Reinforcement (solid line) vs one that excludes them (dash line). Right: Progressive increase in the area under the curve for a sequence of neural networks with 1, 2, 3, and so on up to 100 hidden nodes in a single hidden layer for connectionist models that include (solid line) and exclude (dash line) Utilitarian and Informational Reinforcement variables
