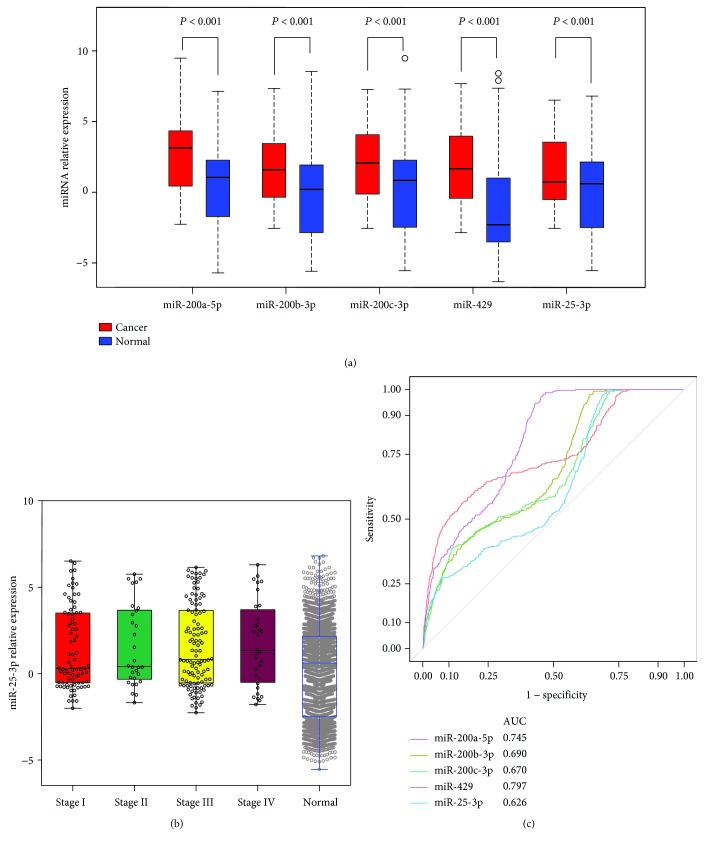
Figure 4.
Quantification of candidate miRNAs in the validation set. (a) Box plot comparing miRNA concentrations in the serum of healthy women and patients with ovarian cancer. (b) The relative expression of miR-25-3p in the serum of healthy women and ovarian cancer patients stratified by tumor grade. (c) Receiver operating characteristic curve for candidate miRNAs showing its potential to discriminate ovarian cancer patients from healthy women.

