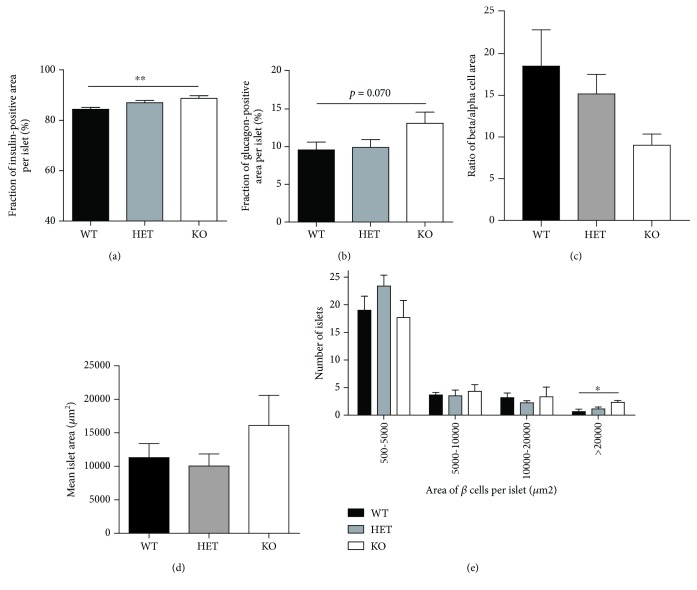
Figure 2.
(a-d) The relative fraction of insulin- or glucagon-positive cells, ratio of β/α cells, and area of immunoreactive cells were measured in six randomly selected islets per section. (e) Quantification of area of all islets in each section using the software Zen Black. Results are shown as means + SEMs. Statistical significance was determined using one-way ANOVA. ∗∗ p < 0.01, ∗ p < 0.05.

