Figure 5.
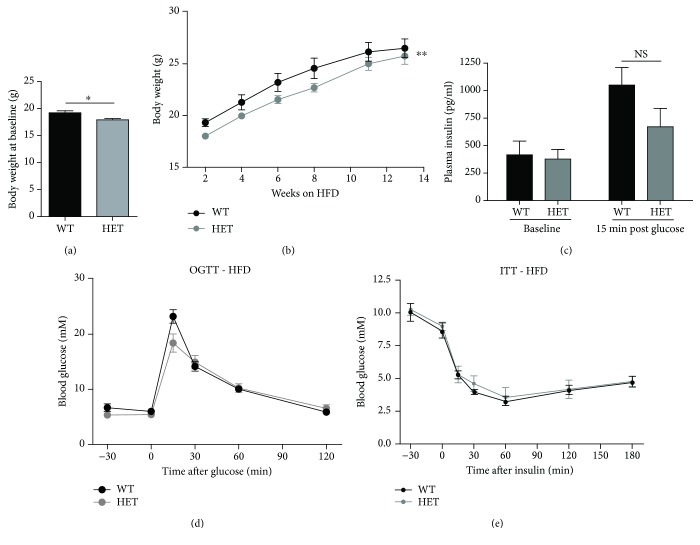
HFD cohort–phenotypic characterization. Wild-type (n = 9) and haploinsufficient mice (n = 7) were fed HFD (consisting of 60% fat compared to 11% in normal chow) for 13 weeks from age of 2-5 weeks. (a) Body weight at day 0 of HFD diet. (b) Body weight during 13 weeks of HFD. (c, d) OGTT. Following 13 weeks of HFD, mice were fasted overnight (16-18 hours) with access to water ad libitum. Blood samples were taken from a tail puncture at the indicated time points for measurement of glucose. (c) For measurement of insulin, a blood sample was taken from orbital sinus at time points -30 and 15 min for each genotype during OGTT. (d) Glucose excursion curves are shown for each genotype. AUC is shown for comparison of differences in glucose excursions. (e) ITT. Mice were fasted 2 hours prior to ITT with access to water ad libitum. Insulin (0.75 U/kg body weight) was injected i.p. Results are shown as means + SEMs. Statistical significance was determined using one- or two-way ANOVA. ∗ p < 0.05.

