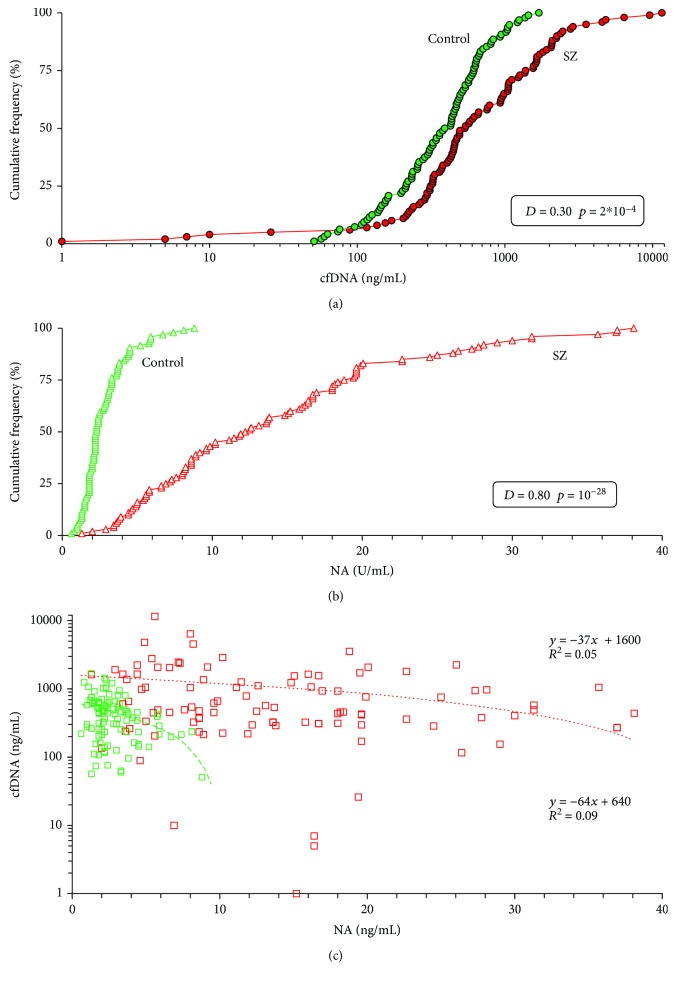
Figure 1.
In the untreated male SZ patients, plasma cfDNA concentration and endonuclease activity are increased. (a) Cumulative curves (distributions) of the cfDNA concentrations in the control group (N = 96) and the SZ group (N = 100). Table presents the data of the Kolmogorov-Smirnov statistics nonparametric for pairwise comparison of the two groups. Table 2 (line 1) presents the descriptive statistics and comparison of two samples using the U test. (b) Cumulative curves of the index NA in the control group and the SZ group. Table presents the data of the Kolmogorov-Smirnov statistics. Table 2 (line 6) presents the descriptive statistics and comparison of two samples with U test. (c) The dependence of the cfDNA concentrations in blood plasma of the individuals on index NA. Green: control group; red: SZ group.

