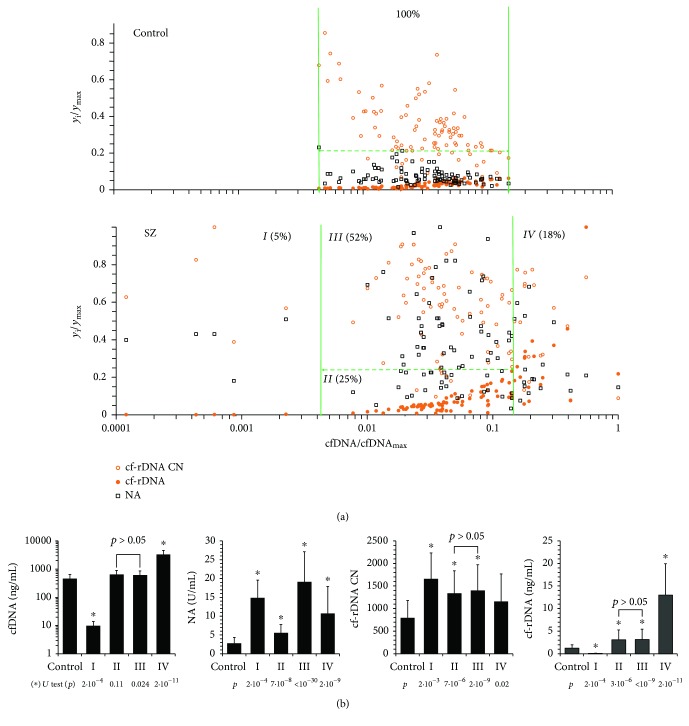
Figure 4.
The characteristics of the cfDNA in patients with schizophrenia vary significantly as compared with the control. (a) Dependence of the relative cf-rDNA CN, cf-rDNA concentration, and NA values on the relative cfDNA concentration for the control and SZ groups. The relative values are obtained by means of dividing the respective value by the maximum value in each index group. The legend of the parameters is given in (a) in the box. The vertical and horizontal lines separate the values of relative cfDNA and NA parameters for the control group. (b) Comparison of cfDNA and cf-rDNA concentrations and index NA and cf-rDNA CN in SZ subgroups I-IV and the control group. U test data are given.

