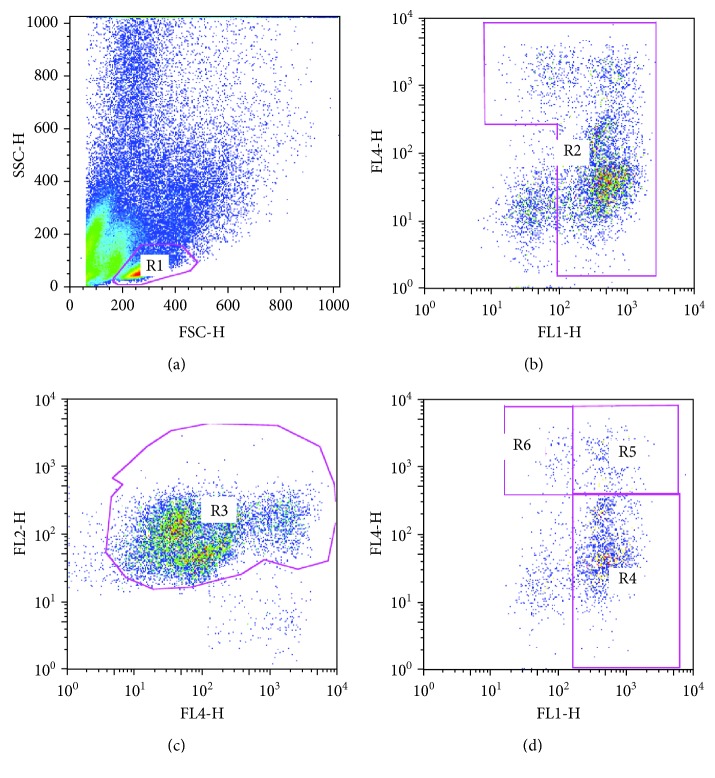
Figure 1.
Representative flow cytometry strategy. Cells are visualized on FSC vs. SSC, and gate R1 is drawn around the monocyte cloud (a). These cells are then viewed on a CD14 (FITC, FL1-H) vs. CD16 (APC, FL4-H) plot, and gate R2 is drawn around the monocyte cloud (b). Gate R2 cells are viewed on a CD16 (APC, FL4-H) vs. HLA-DR (PE, FL2-H) plot, and HLA-DR-negative NK cells were excluded drawing R3 gate (c). Then, R3 monocyte population is viewed again on a CD14 (FITC, FL1-H) vs. CD16 (APC, FL4-H) plot, and CD14++CD16- (gate R4), CD14++CD16+ (gate R5), and CD14+CD16++ (gate R6) cells are defined according to the surface expression of CD14 and CD16 (d).

