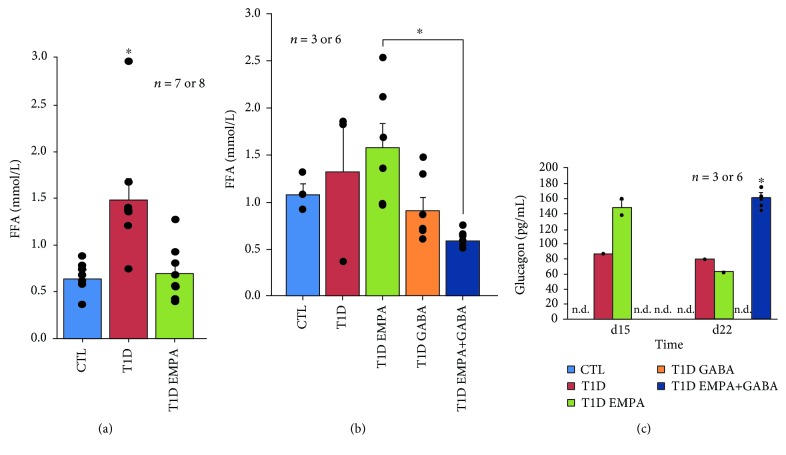
Figure 2.
Effect of empagliflozin, GABA, and their combination on free fatty acid and glucagon levels. Blood samples of the control mice (CTL, blue bar); untreated diabetic mice (T1D, red bar); and mice treated with empagliflozin (T1D EMPA, green bar), GABA (T1D GABA, orange bar), or empagliflozin and GABA (T1D EMPA+GABA, navy blue bar) were collected at different time points: at the end for FFA dosage (a and b) and at d15 and d22 for glucagon dosage by multiplex (c). (a) Protocol #1: asterisk (∗) indicates a statistically significant difference (p = 0.009 and p = 0.008, respectively; Kruskal-Wallis) between the T1D group and the CTL and T1D EMPA groups. (b) Protocol #2: asterisk (∗) shows that there is a significant difference (p = 0.011; Kruskal-Wallis) between the T1D EMPA group and the T1D EMPA+GABA group. (c) n.d. means undetectable. Asterisk (∗) indicates a statistically significant difference (p < 0.05; Kruskal-Wallis) between the CTL, T1D EMPA and T1D GABA groups, and the T1D EMPA+GABA group. Each black point represents an individual. The bars represent the standard error of the mean. For each protocol, the number of mice per group is indicated (n = 7 or 8, n = 3 or 6).

