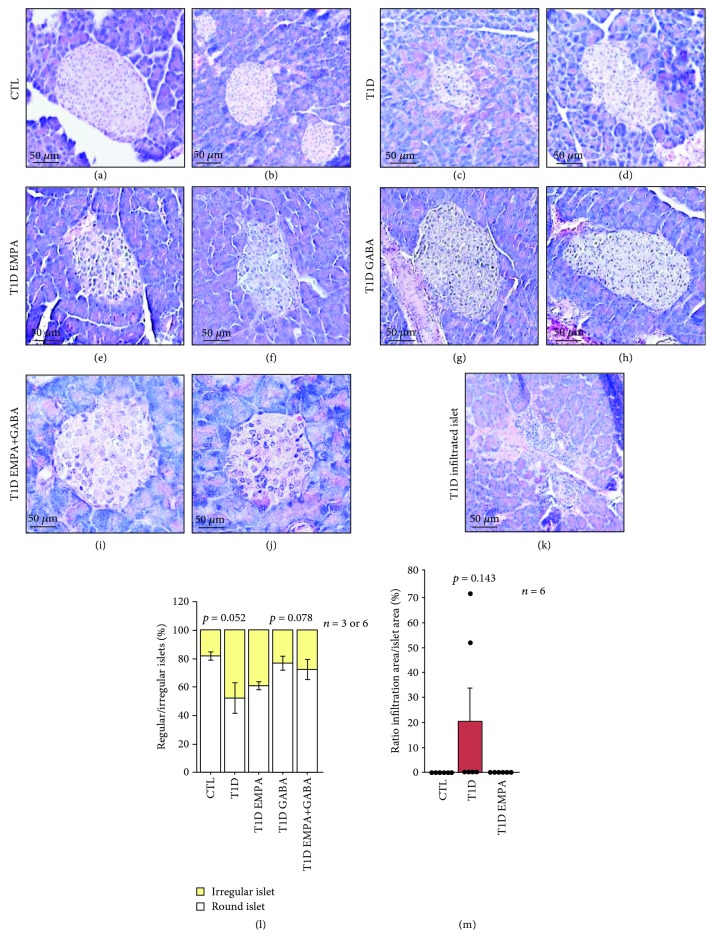
Figure 4.
Effect of empagliflozin, GABA, and their combination on islet morphology. At the end of the treatment, the pancreas of control mice (CTL) (a and b); untreated diabetic mice (T1D) (c, d, and k); and mice treated with empagliflozin (T1D EMPA) (e and f), GABA (T1D GABA) (g and h), and both drugs (T1D EMPA+GABA) (i and j) were removed. The pancreas was divided into three parts, and its tail was used for hematoxylin and eosin coloration. Images were obtained thanks to the Zeiss Axio Scope A.1 microscope (40x/0.75), the Zeiss Axiocam MRc5 Microscope Camera (0.63x) and the software Zen (20 ms of exposure). Scale bar = 50 μm. (l) The percentage of regular and irregular islets was obtained using Visiopharm software. p = 0.052 and p = 0.078 show the difference between the T1D group and the CTL and T1D GABA groups (ANOVA-Welch). (m) The percentage of infiltrated islets was calculated using the Digital Image Hub software from Leica. Each black point represents an individual. The statistics were performed using a Kruskal-Wallis test. The bars represent the standard error of the mean. For each protocol, the number of mice per group is indicated (n = 3 or 6 and n = 6). For each mouse, two slides with two tissue sections were analyzed.

