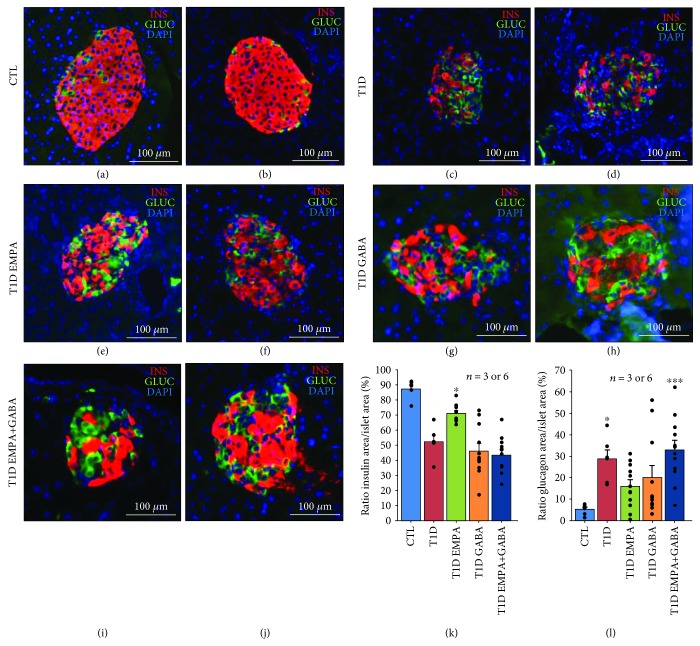
Figure 5.
Effect of empagliflozin, GABA, and their combination on the Langerhans islet preservation. At the end of the treatment, the pancreas of control mice (CTL) (a and b); untreated diabetic mice (T1D) (c and d); and mice treated with empagliflozin (T1D EMPA) (e and f), GABA (T1D GABA) (g and h), and both drugs (T1D EMPA+GABA) (i and j) were removed. The pancreas was divided into three parts, and its tail was used for insulin and glucagon staining. The red, green, and blue staining corresponds to insulin, glucagon, and DAPI (nucleus), respectively. Scale bar = 100 m. For protocol #2, the ratio of insulin (k) or glucagon (l) area per islet area was calculated for control mice (CTL, blue bar) and diabetic mice (T1D, red bar) treated with empagliflozin (T1D EMPA, green bar), GABA (T1D GABA, orange bar), or both (T1D EMPA+GABA, navy blue bar), thanks to the 3DHistech Pannoramic P250 Flash III slide scanner and Visiopharm software. (k) Asterisk (∗) shows a significant difference (p < 0.05; Kruskal-Wallis) between the T1D EMPA group and the T1D GABA and T1D EMPA+GABA groups. (l) Asterisks (∗ and ∗∗∗) show a significant difference (p = 0.014 and p = 0.001, respectively; Kruskal-Wallis) between the CTL group and the T1D and T1D EMPA+GABA groups. Each black point represents an individual. The bars represent the standard error of the mean. For each protocol, the number of mice per group is indicated (n = 3 or 6). For each mouse, two slides with two tissue sections were analyzed.

