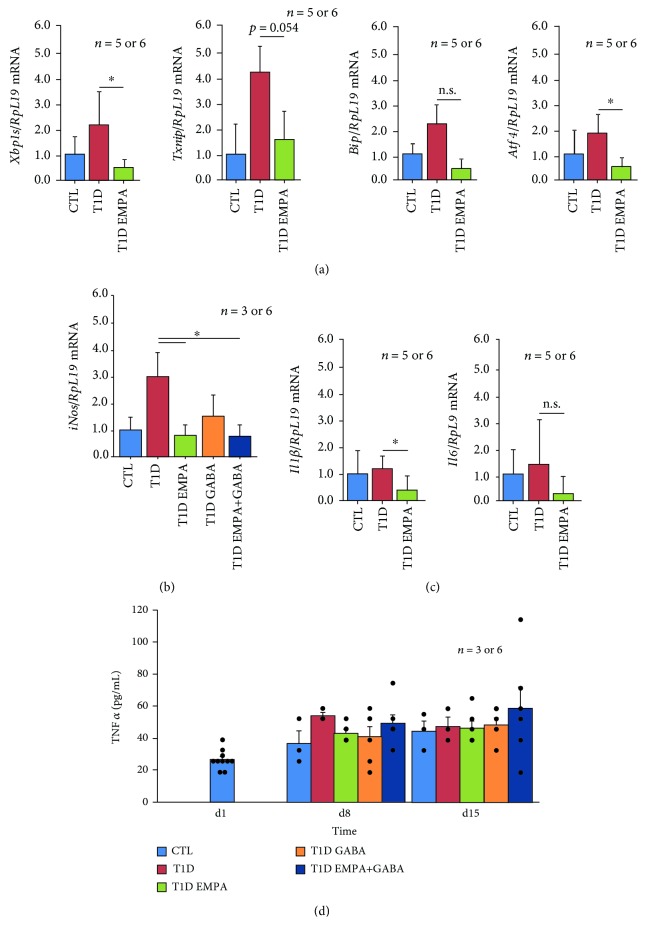
Figure 6.
Effect of empagliflozin and GABA on the expression of ER stress, oxidative stress, and inflammation markers. At the end of the treatment, the pancreas of control mice (CTL, blue bar); untreated diabetic mice (T1D, red bar); and mice treated with empagliflozin (T1D EMPA, green bar), GABA (T1D GABA, orange bar), and both (T1D EMPA+GABA, navy blue bar) were taken. The pancreas was divided into three parts, and its body was used for RT-qPCR for the expression of ER stress (a), oxidative stress (b), and inflammation (c) markers. Asterisk (∗) shows a significant difference (p < 0.05) between T1D mice and T1D EMPA or T1D EMPA+GABA mice. n.s. means nonsignificant. (d) During the studies, blood was collected at different time points in order to analyze TNFα secretion, an inflammation marker. There is no experimental difference between the five different samples at day 1; thus, they were displayed as one sample. Each black point represents an individual. The bars represent the standard error of the mean. For each protocol, the number of mice per group is indicated (n = 5 or 6 and n = 3 to 6). Statistical analyses were performed using a t-test for the qPCR results or using a Kruskal-Wallis test for the d15 glucagon results or using an ANOVA-Tukey test for the d22 glucagon results.

