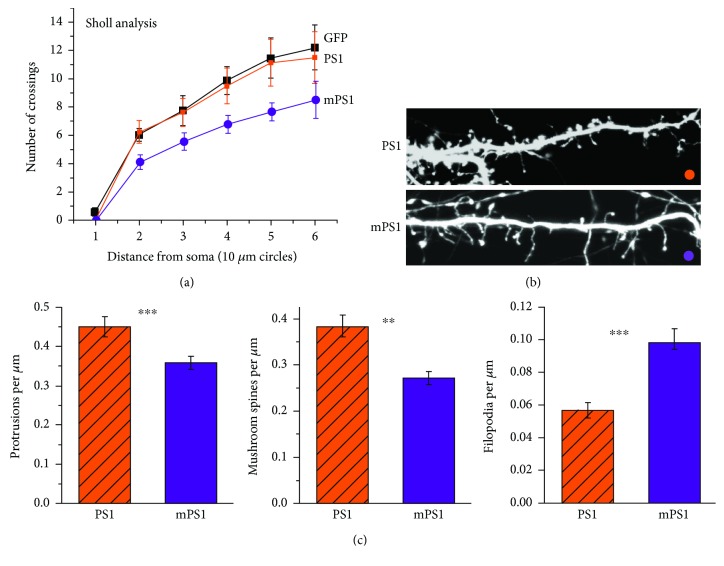
Figure 1.
Morphological analysis of dendritic arbors and spines in 14 DIV cultured hippocampal neurons transfected with GFP and PS1 or mPS1. (a) Sholl analysis counting the number of dendrites in 10 μm perimeters around the cell somata. A significant difference was found between mPS1 and the other two groups of neurons. (b) Live images were taken at higher resolution, and the results summarize observations in 30 and 31 dendrites in 10-12 cells in the two groups. Three dimension images were analyzed using ImageJ (see Section 2). The total number of protrusions (c, left) as well as the density of mushroom spines (middle) was significantly lower in the mPS1 group compared to the PS1 group, while the mutant cells expressed higher density of filopodia (long, headless protrusions, right). The differences were highly significant (in this and the following figures ∗ p < 0.05, ∗∗ p < 0.01, and ∗∗∗ p < 0.001).

