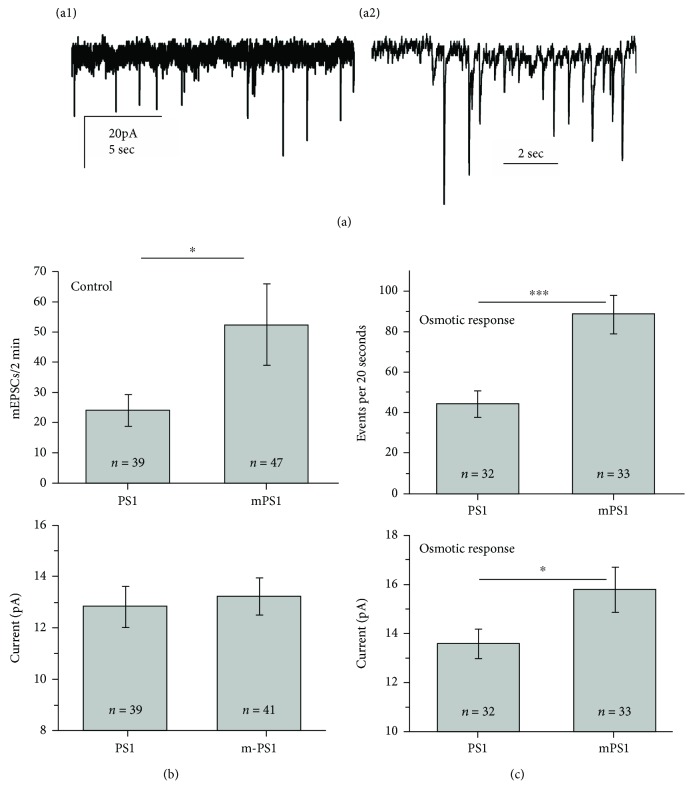
Figure 2.
Comparisons of mEPSCs between PS1- and mPS1-transfected neurons. Neurons were recorded in the presence of TTX for 2 minutes, and the number and size of individual mEPSCs were measured and averaged for each cell. Following, in some experiments, the responses to pressure application of sucrose-containing medium were recorded for 20 seconds. (a) A record of mEPSCs in the standard condition (A1) and in response to the sucrose-containing medium (A2). Note difference in time scales between the two records. (b) Comparisons of mean rate (top) and amplitude in the two groups. The rate in the mPS1 group was significantly higher than that in the PS1 group, despite the large variability. (c) In response to hyperosmotic pulses, the values represent mean frequency and size over 20 seconds of recording. A highly significant (p < 0.001) increase in mean rates and a significant difference (p < 0.05) also in mean size of mEPSCs are obvious.

