Figure 3.
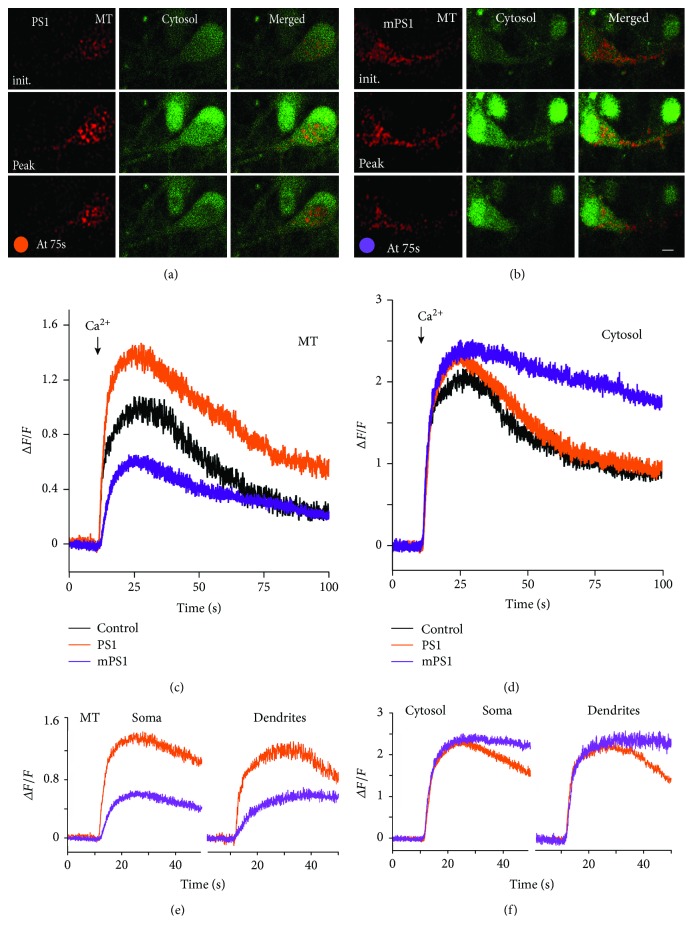
Cells transfected with mPS1 (b) raise mitochondrial calcium ([Ca2+]M) to lower levels than PS1 (a) in response to a switch in ambient [Ca2+]o from 0 (top row, initial) to 2 mM (middle row, peak). Cells were imaged up to 100 s after medium switch (bottom row) to show a recovery from the calcium surge. Cells were cotransfected with eBFP to image morphology, MtRCaMP to image calcium in mitochondria (MT), and PS1 or mPS1. Cultures were loaded with 2 μM Fluo-2AM for 50 minutes prior to imaging, to measure cytosolic calcium. Cells were imaged for 15 minutes after the removal of ambient calcium from the medium and for 100 s after the addition of 2 mM CaCl2 to the medium, simultaneously for the mitochondrial and cytosolic calcium at a rate of 20 frames/s. There was a fast increase in [Ca2+]M in the somata of the PS1-transfected neurons and a significantly smaller rise in the mPS1-transfected neurons (c). In the same cells, cytosolic calcium raised to the same level in the three groups (d) but recovered much slower in the mPS1 neurons than in the other groups. At least five different locations for each cell were averaged. N = control, 10 cells; PS1, 19 cells; and mPS1, 16 cells. (e, f) Same neurons, imaged in the soma and the dendrites, showing similar disparity between the two groups of neurons. For clarity, only the results of the two plasmids are shown, leaving the controls outside the picture. Consult text for details of the analysis.

