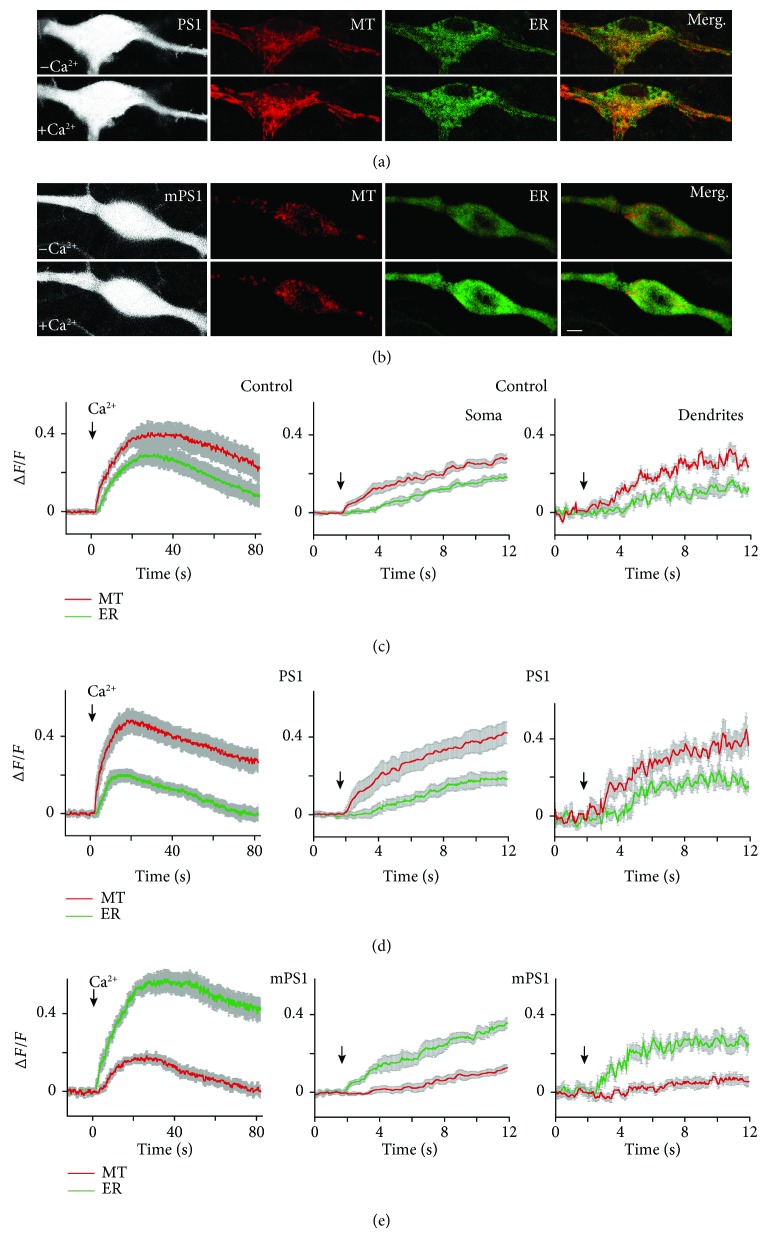
Figure 4.
Simultaneous measurements of changes in mitochondrial and ER calcium. (a, b) Cells were cotransfected with ER-GCaMP, MT-RCaMP, PS1 or mPS1, and eBFP at the age of 7-8 days and imaged 2-4 days later. Calcium was removed from imaging medium for 15 minutes and then recovered as above. Imaging was performed using double track mode (no simultaneous illumination), at the rate of 10 frames/s, during about 90 s, using argon (488) and HeNe (543) wavelengths with 40x water immersion objective (NA = 1). At least 5-7 specific locations were averaged for each cell. n: 22 control cells, 36 PS1cells, and 32 mPS1cells. (c–e) Left column, measurements in the three groups at the soma region, as indicated. Middle, expanded traces of the onset of the responses to calcium in cells shown on the left. Right column, measurements of the onset of responses in dendrites of the same cells, in an expanded scale.

