Figure 5.
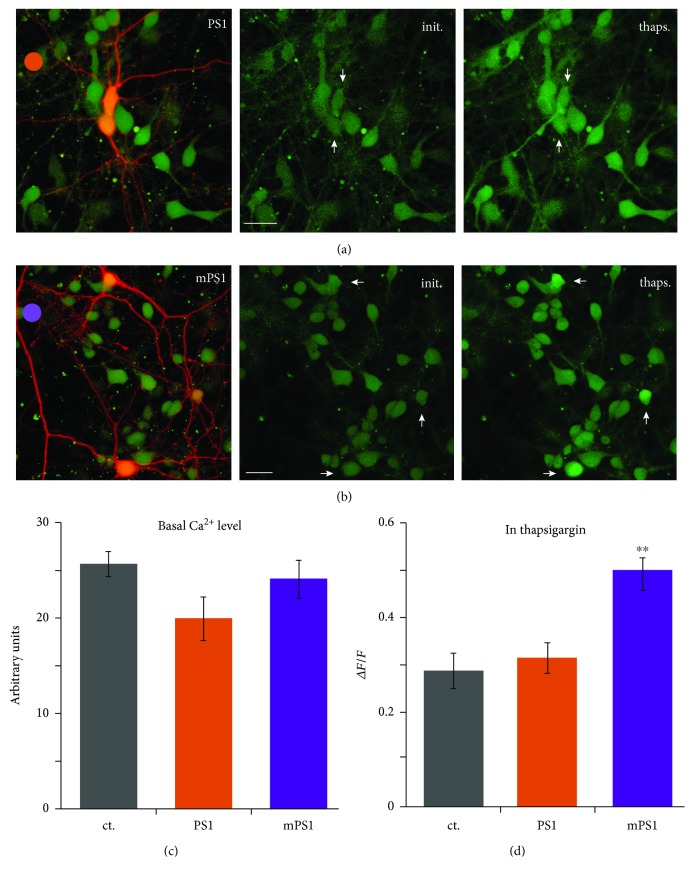
Changes in cytosolic calcium in response to thapsigargin are larger in mPS1-transfected neurons than in the other groups. Cells were transfected with PS1 or mPS1 and DsRed. Cultures were loaded with Fluo-2AM prior to imaging. Single sections were continuously imaged at the rate of 10 frames/s, and thapsigargin (1 μM) was applied to the bath. Maximum responses were used for averaging. (a) PS1-transfected neurons (red) among nontransfected ones. (b) mPS1-transfected neurons. Left images combining the red transfected neurons and the nontransfected Fluo-2-loaded neurons. Middle and right columns in control and in the presence of thapsigargin, respectively. Scale bar 20 μm. Arrowheads point to the transfected neurons. (c, d) Fluorescence levels in baseline where fluorescence is expressed in arbitrary units and (d) during exposure to thapsigargin, where fluorescence is expressed as a change relative to baseline. n: control—8 fields, containing 14 transfected cells; PS1—7 fields, containing 14 transfected cells; and mPS1—8 fields, containing 17 transfected cells. mPS1 is highly significant above PS1 and control cells.

