Figure 6.
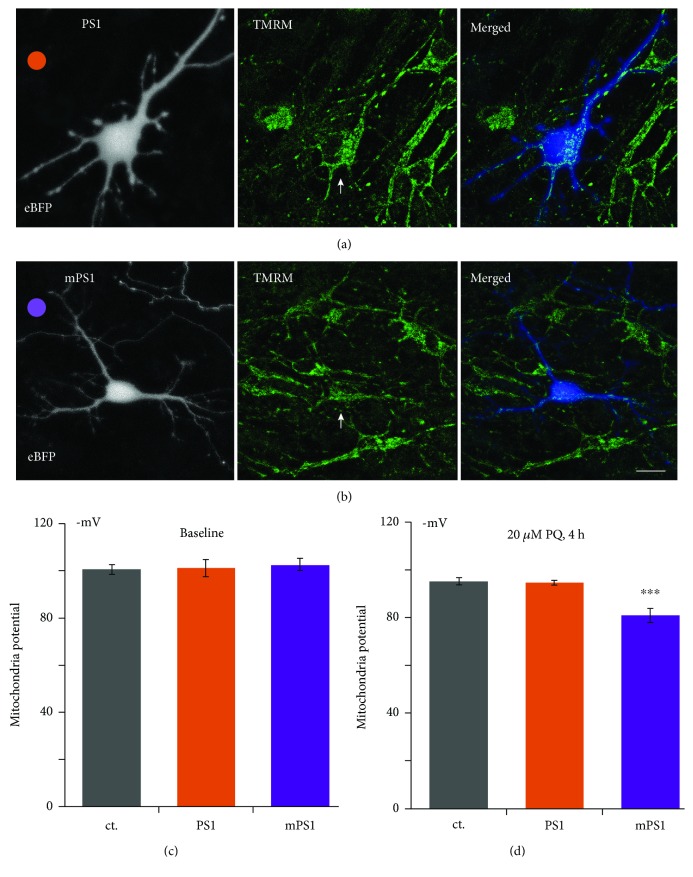
Mitochondrial membrane potential is more depolarized in stressed mPS1-transfected neurons. Cells were cotransfected with eBFP to image morphology and PS1 (a) or mPS1 (b). Prior to imaging, cells were incubated with TMRM (10 μl/ml) for 25 minutes in the 37°C incubator. Cells were 3D imaged (about 1 μm/section, 15-17 optical sections per cell). Paraquat (20 μM) was added to the bath for 4 h. At least 5 MT-containing locations were averaged for each cell. n: 6 fields containing 10 transfected cells for each condition in baseline and 8 fields containing 10 control cells, 16 PS1 cells, and 15 mPS1 cells. Images (from left to right): eBFP-transfected neurons to outline the morphology of the cell, TMRM fluorescence to image mitochondrial potential, and a merged image (right). Scale bar 5 μm. (c) In resting conditions, no difference among the three groups of neurons. (d) During exposure to paraquat (PQ) for 4 hours, showing more depolarized potentials in all three groups compared to baseline, but the largest effect was seen in the mPS1 group (p < 0.00012).

