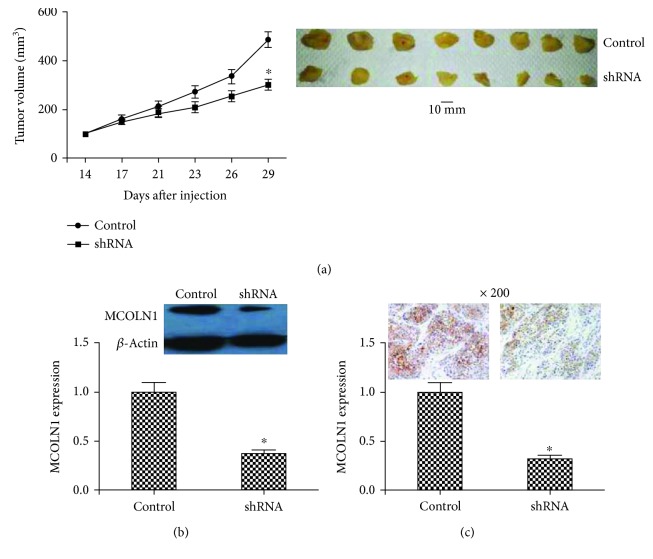
Figure 3.
In vivo animal experiments. (a) At the 14th day after injection, the tumor volume was measured every day. The growth curve showed that the tumors in the MCOLN1 group grew more slowly than controls. After inoculation of 29 days, the final tumor tissues were obtained. The tumors in the shRNA group were smaller than controls. (b, c) The expression of MCOLN1 in tumors of mice was detected by western blot or IHC. MCOLN1 expression was dramatically decreased in the shRNA group, which confirmed the effective silencing of MCOLN1 in tumors of mice in the shRNA group. “∗” represents the significant association (P < 0.05 for the difference was significant).

