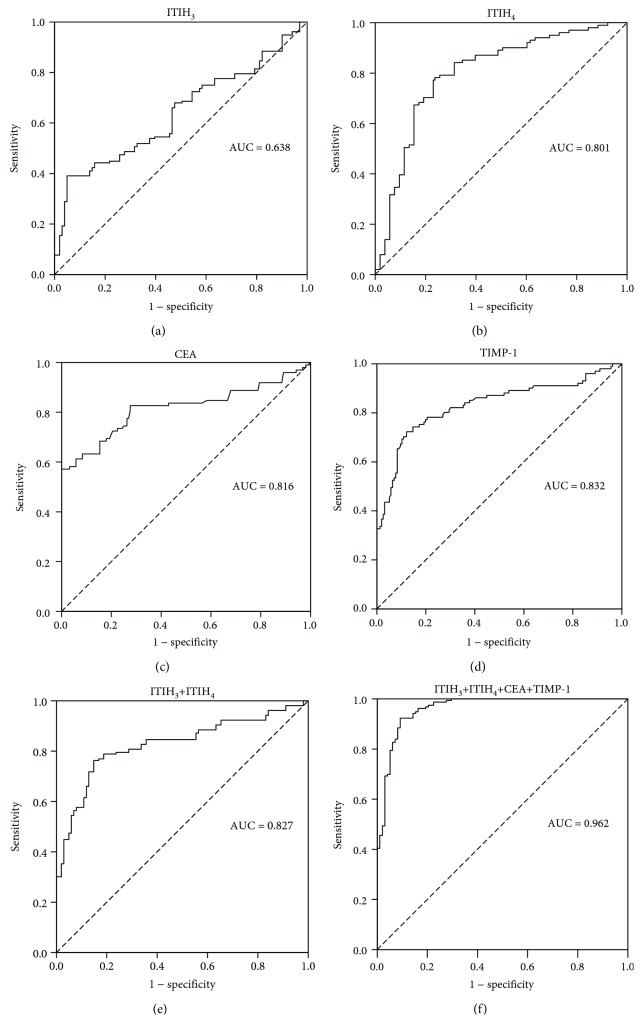
Figure 2.
The receiver operating characteristic (ROC) curves were plotted for the biomarkers. (a) The ROC curve for ITIH3 (area under the curve (AUC) = 0.638). (b) The ROC curve for ITIH4 (AUC = 0.801). (c) The ROC curve for CEA (AUC = 0.816). (d) The ROC curve for TIMP-1 (AUC = 0.832). (e) The diagnostic accuracy of ITIH3 and ITIH4 combinations was assessed by a logistic regression model. The ROC curve for combined ITIH3 and ITIH4 (AUC = 0.827). (f) The combinations of CEA, TIMP-1, ITIH3, and ITIH4 yielded the highest diagnostic accuracy (AUC = 0.962).

