Figure 3.
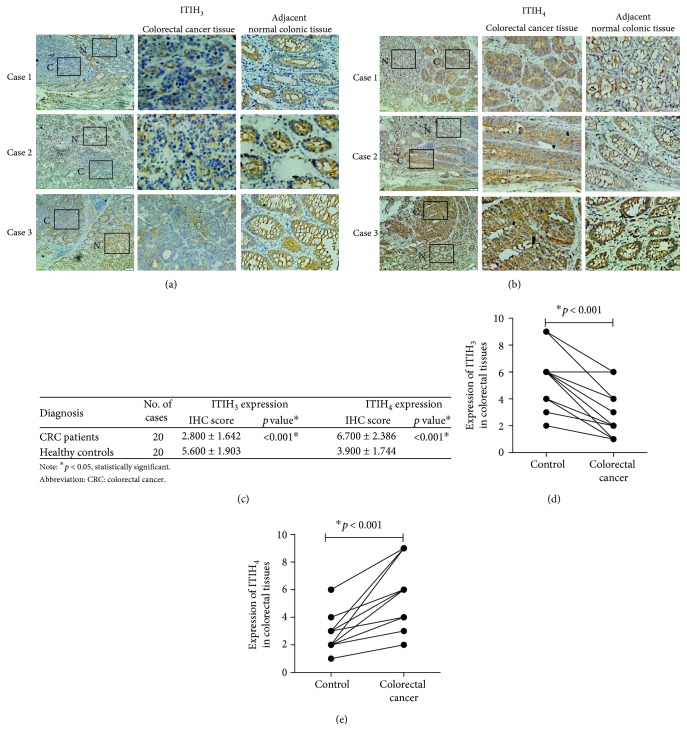
The expressions of ITIH3 or ITIH4 in human CRC tissues and their adjacent normal colorectal tissues were analyzed by immunohistochemical (IHC) staining. (a) The expressions of ITIH3 in CRC tissues and the normal colorectal tissues. The boxed areas lined with black color in the left images of (a, b) were magnified in the middle and right ones. N: adjacent normal tissue (shown in the right column); C: CRC tissue (shown in the middle column). Original magnification, ×100-fold. (b) The expressions of ITIH4 in CRC tissues compared with the normal colorectal tissues. (c) The IHC scores of the expressions for ITIH3 and ITIH4; the p values were acquired by paired t-test. (d, e) The individual line plot diagrams described the IHC scores of ITIH3 and ITIH4 expressions.

