Figure 3.
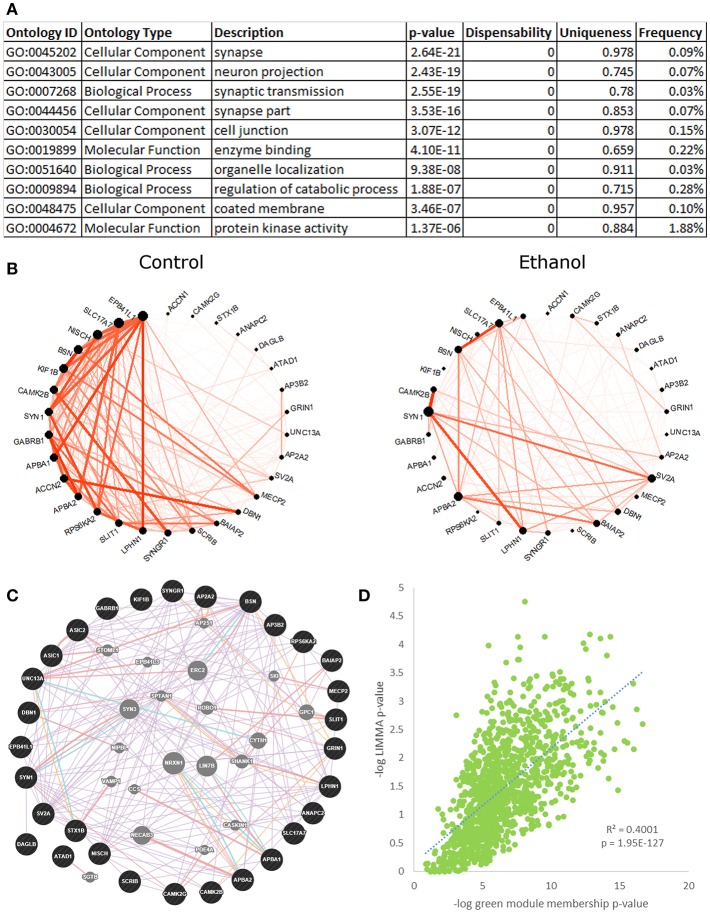
Green module characteristics: synaptic transmission. (A) The top 10 functional enrichments from the REVIGO summary of ToppFun analysis are shown. Most pertain to synaptic transmission. (B) Circle plot of genes from the “synaptic transmission” ontology hits that were also ethanol-regulated by LIMMA (p < 0.01) showed a clear decrease in connectivity in the ethanol-treated animals. (C) A network diagram from GeneMania supports the finding that the synaptic transmission genes in (B) are highly interconnected, using data from the literature. This network contains several potential hub genes. The arrangement of nodes was modified to better display the number of connections to each query gene (black). Genes added to the network based on connections from the literature are shown in gray. (D) Scatterplot of the negative log of green module membership p-value vs. negative log of LIMMA p-value for each probeset in the green module. Note the highly significant positive correlation.

