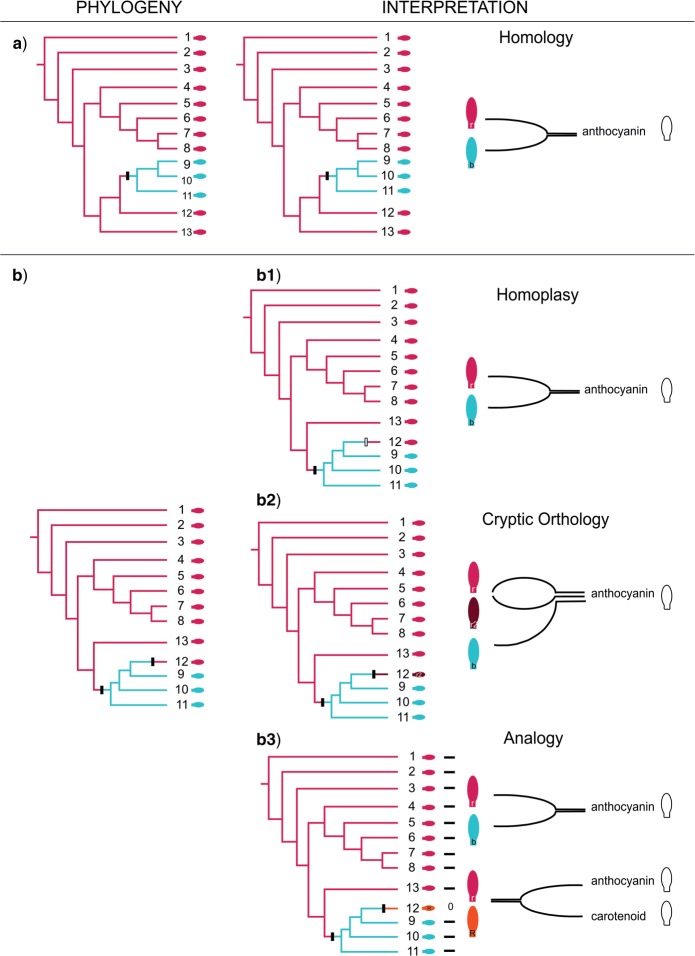
Figure 5.
Theoretical outline of a homology assessment. The left column shows two hypothetical cladograms (a, b) which are used for homology assessments of a specific structure, in casu petal pigments. The middle column shows the homology assessments in function of each of the cladograms. The right column shows the interpretations of the observations of petal pigments, reflected in the character coding (as a single character with two or three character states; or as two characters). Excluding horizontal gene transfer, if two as orthologous confirmed character states blue (white) and red (light grey) have the same origin in the phylogenetic tree, they are corroborated as homologs (a). Apparent two independent origins for a single character state (red-light grey, b) can be explained in three different ways: homoplasy (b1), cryptic orthology (b2), or analogy (b3). Homoplasy implies independent origins for the same ortholog, for example a reversal. Cryptic orthologs and analogs imply error in the character coding: if in b2, the red (light and dark grey) petals are erroneously interpreted to be a single character state, apparent homoplasy results. If in contrast the cryptic orthologs are recognized as such and coded as two different character states (r1 and r2), the apparent homoplasy is explained by the existence of three (blue-white and two reds-light and dark grey) character states. If in b3 the red pigments (light grey and black) are interpreted as a single character state (r) next to blue (white) (b), both of anthocyanin origin, apparent homoplasy results. If in contrast the caretenoid origin of one of the reds (R) is recognized as such, this red (black) is assigned to another, analogous character and the apparent homoplasy is explained. Symbols: black hash mark = synapomorphy; gray hash mark = homoplasy. This figure appears in color in the online version of the article.

