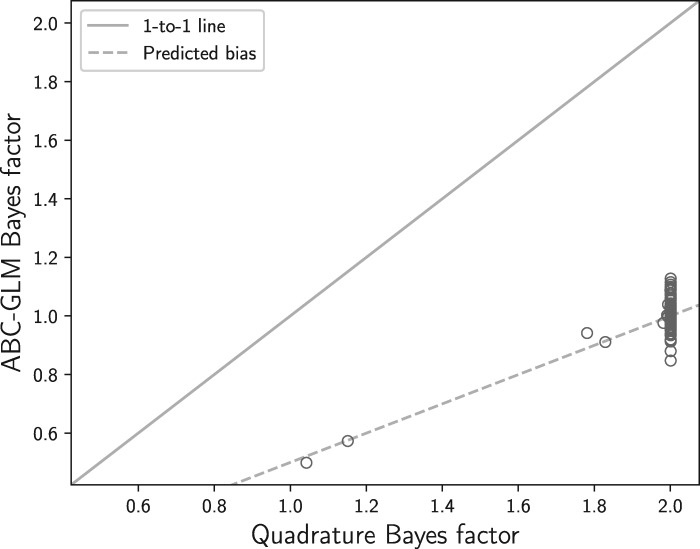
Figure 2.
A comparison of the approximate-likelihood Bayesian computation general linear model (ABC-GLM) estimator of the marginal likelihood (Leuenberger and Wegmann 2010) to quadrature integration approximations (Xie et al. 2011) for 100 simulated data sets. We compared the ratio of the marginal likelihood (Bayes factor) comparing the correct branch-length model [branch length  uniform(0.0001, 0.1)] to a model with a broader prior on the branch length [branch length
  uniform(0.0001, 0.2)]. The solid line represents perfect performance of the ABC-GLM estimator (i.e., matching the “true” value of the Bayes factor). The dashed line represents the expected Bayes factor when failing to penalize for the extra parameter space (branch length 0.1 to 0.2) with essentially zero likelihood. Quadrature integration with 1000 and 10,000 steps using the rectangular and trapezoidal rule produced identical values of log marginal likelihoods to at least five decimal places for all 100 simulated data sets.

